01 [기술 통계 분석 + 그래프]
와인 품질 등급 예측하기
from google.colab import files
uploaded = files.upload()
winequality-red.csv
winequality-red.csv(text/csv) - 84199 bytes, last modified: 2023. 1. 7. - 100% done
Saving winequality-red.csv to winequality-red.csv

uploaded = files.upload()
winequality-white.csv
winequality-white.csv(text/csv) - 264426 bytes, last modified: 2023. 1. 7. - 100% done
Saving winequality-white.csv to winequality-white.csv- 엑셀에서 열 구분자를 세미콜론으로 인식시키기
import pandas as pd
red_df = pd.read_csv('winequality-red.csv', sep = ';', header = 0, engine = 'python')
white_df = pd.read_csv('winequality-white.csv', sep = ';', header = 0, engine = 'python')
red_df.to_csv('winequality-red2.csv', index = False)
white_df.to_csv('winequality-white2.csv', index = False)
2. 레드 와인과 화이트 와인 파일 합치기
red_df.head()
red_df.insert(0, column = 'type', value = 'red')
red_df.head()
red_df.shape
(1599, 13)

white_df.head()
white_df.insert(0, column = 'type', value = 'white')
white_df.head()
white_df.shape
(4898, 13)

wine = pd.concat([red_df, white_df])
wine.shape
(6497, 13)

wine.to_csv('wine.csv', index = False)
데이터 탐색
- 기본 정보 확인하기
print(wine.info())
<class 'pandas.core.frame.DataFrame'>
Int64Index: 6497 entries, 0 to 4897
Data columns (total 13 columns):
 #   Column                Non-Null Count  Dtype
---  ------                --------------  -----
 0   type                  6497 non-null   object
 1   fixed acidity         6497 non-null   float64
 2   volatile acidity      6497 non-null   float64
 3   citric acid           6497 non-null   float64
 4   residual sugar        6497 non-null   float64
 5   chlorides             6497 non-null   float64
 6   free sulfur dioxide   6497 non-null   float64
 7   total sulfur dioxide  6497 non-null   float64
 8   density               6497 non-null   float64
 9   pH                    6497 non-null   float64
 10  sulphates             6497 non-null   float64
 11  alcohol               6497 non-null   float64
 12  quality               6497 non-null   int64
dtypes: float64(11), int64(1), object(1)
memory usage: 710.6+ KB
None
2. 함수를 사용해 기술 통계 구하기
wine.columns = wine.columns.str.replace(' ', '_')
wine.head()
wine.describe()
sorted(wine.quality.unique())
[3, 4, 5, 6, 7, 8, 9]

wine.quality.value_counts()
6    2836
5    2138
7    1079
4     216
8     193
3      30
9       5
Name: quality, dtype: int64
데이터 모델링 1 describe() 함수로 그룹 비교하기
wine.groupby('type')['quality'].describe()
wine.groupby('type')['quality'].mean()
type
red      5.636023
white    5.877909
Name: quality, dtype: float64

wine.groupby('type')['quality'].std()
type
red      0.807569
white    0.885639
Name: quality, dtype: float64

wine.groupby('type')['quality'].agg(['mean', 'std'])
t-검정과 회귀 분석으로 그룹 비교하기
pip install statsmodels
Looking in indexes: https://pypi.org/simple, https://us-python.pkg.dev/colab-wheels/public/simple/
Requirement already satisfied: statsmodels in /usr/local/lib/python3.8/dist-packages (0.12.2)
Requirement already satisfied: pandas>=0.21 in /usr/local/lib/python3.8/dist-packages (from statsmodels) (1.3.5)
Requirement already satisfied: patsy>=0.5 in /usr/local/lib/python3.8/dist-packages (from statsmodels) (0.5.3)
Requirement already satisfied: numpy>=1.15 in /usr/local/lib/python3.8/dist-packages (from statsmodels) (1.21.6)
Requirement already satisfied: scipy>=1.1 in /usr/local/lib/python3.8/dist-packages (from statsmodels) (1.7.3)
Requirement already satisfied: python-dateutil>=2.7.3 in /usr/local/lib/python3.8/dist-packages (from pandas>=0.21->statsmodels) (2.8.2)
Requirement already satisfied: pytz>=2017.3 in /usr/local/lib/python3.8/dist-packages (from pandas>=0.21->statsmodels) (2022.7)
Requirement already satisfied: six in /usr/local/lib/python3.8/dist-packages (from patsy>=0.5->statsmodels) (1.15.0)

from scipy import stats
from statsmodels.formula.api import ols, glm
red_wine_quality = wine.loc[wine['type'] == 'red', 'quality']
white_wine_quality = wine.loc[wine['type'] == 'white', 'quality']
stats.ttest_ind(red_wine_quality, white_wine_quality, equal_var = False)
Ttest_indResult(statistic=-10.149363059143164, pvalue=8.168348870049682e-24)

Rformula = 'quality ~ fixed_acidity + volatile_acidity + citric_acid + residual_sugar + chlorides + free_sulfur_dioxide + total_sulfur_dioxide + density + pH + sulphates + alcohol'
regression_result = ols(Rformula, data = wine).fit()
regression_result.summary()
회귀 분석 모델로 새로운 샘플의 품질 등급 예측하기
sample1 = wine[wine.columns.difference(['quality', 'type'])]
sample1 = sample1[0:5][:]
sample1_predict = regression_result.predict(sample1)
sample1_predict
0    4.997607
1    4.924993
2    5.034663
3    5.680333
4    4.997607
dtype: float64

wine[0:5]['quality']
0    5
1    5
2    5
3    6
4    5
Name: quality, dtype: int64

data = {"fixed_acidity": [8.5, 8.1], "volatile_acidity":[0.8, 0.5], "citric_acid":[0.3, 0.4], "residual_sugar":[6.1, 5.8],
        "chlorides":[0.055, 0.04], "free_sulfur_dioxide":[30.0, 31.0], "total_sulfur_dioxide":[98.0, 99], "density":[0.996, 0.91],
        "pH":[3.25, 3.01], "sulphates":[0.4, 0.35], "alcohol":[9.0, 0.88]}
sample2 = pd.DataFrame(data, columns=sample1.columns)
sample2
sample2_predict = regression_result.predict(sample2)
sample2_predict
0    4.809094
1    7.582129
dtype: float64
결과 시각화
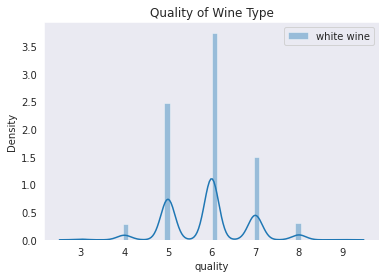
와인 유형에 따른 품질 등급 히스토그램 그리기
import matplotlib.pyplot as plt
import seaborn as sns
sns.set_style('dark')
sns.distplot(red_wine_quality, kde = True, color = "red", label = 'red wine')
/usr/local/lib/python3.8/dist-packages/seaborn/distributions.py:2619: FutureWarning: `distplot` is a deprecated function and will be removed in a future version. Please adapt your code to use either `displot` (a figure-level function with similar flexibility) or `histplot` (an axes-level function for histograms).
  warnings.warn(msg, FutureWarning)
<matplotlib.axes._subplots.AxesSubplot at 0x7f9b26764400>
sns.distplot(white_wine_quality, kde = True, label = 'white wine')
plt.title("Quality of Wine Type")
plt.legend()
plt.show()
/usr/local/lib/python3.8/dist-packages/seaborn/distributions.py:2619: FutureWarning: `distplot` is a deprecated function and will be removed in a future version. Please adapt your code to use either `displot` (a figure-level function with similar flexibility) or `histplot` (an axes-level function for histograms).
  warnings.warn(msg, FutureWarning)
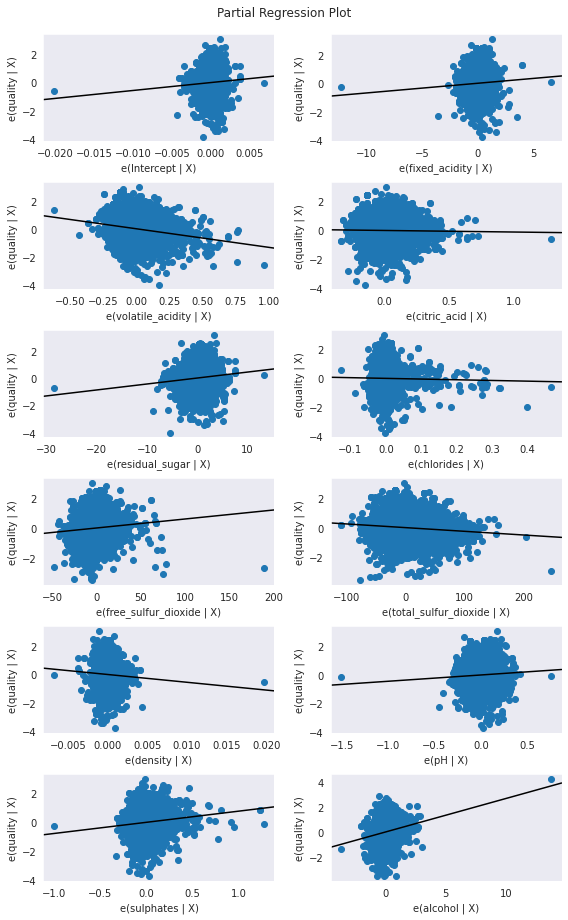
부분 회귀 플롯으로 시각화하기
import statsmodels.api as sm
others = list(set(wine.columns).difference(set(["quality", "fixed_acidity"])))
p, resids = sm.graphics.plot_partregress("quality", "fixed_acidity", others, data = wine, ret_coords = True)
plt.show()
fig = plt.figure(figsize = (8, 13))
sm.graphics.plot_partregress_grid(regression_result, fig = fig)
plt.show()

02. [상관 분석 + 히트맵]
타이타닉호 생존율 분석하기
데이터 수집
import seaborn as sns
import pandas as pd
titanic = sns.load_dataset("titanic")
titanic.to_csv('titanic.csv', index = False)
데이터 준비
titanic.isnull().sum()
survived         0
pclass           0
sex              0
age            177
sibsp            0
parch            0
fare             0
embarked         2
class            0
who              0
adult_male       0
deck           688
embark_town      2
alive            0
alone            0
dtype: int64

titanic['age'] = titanic['age'].fillna(titanic['age'].median())
titanic['embarked'].value_counts()
S    644
C    168
Q     77
Name: embarked, dtype: int64

titanic['embarked'] = titanic['embarked'].fillna('S')
titanic['embark_town'].value_counts()
Southampton    644
Cherbourg      168
Queenstown      77
Name: embark_town, dtype: int64

titanic['embark_town'] = titanic['embark_town'].fillna('Southampton')
titanic['deck'].value_counts()
C    59
B    47
D    33
E    32
A    15
F    13
G     4
Name: deck, dtype: int64

titanic['deck'] = titanic['deck'].fillna('C')
titanic.isnull().sum()
survived       0
pclass         0
sex            0
age            0
sibsp          0
parch          0
fare           0
embarked       0
class          0
who            0
adult_male     0
deck           0
embark_town    0
alive          0
alone          0
dtype: int64
데이터 탐색
titanic.info()
<class 'pandas.core.frame.DataFrame'>
RangeIndex: 891 entries, 0 to 890
Data columns (total 15 columns):
 #   Column       Non-Null Count  Dtype
---  ------       --------------  -----
 0   survived     891 non-null    int64
 1   pclass       891 non-null    int64
 2   sex          891 non-null    object
 3   age          891 non-null    float64
 4   sibsp        891 non-null    int64
 5   parch        891 non-null    int64
 6   fare         891 non-null    float64
 7   embarked     891 non-null    object
 8   class        891 non-null    category
 9   who          891 non-null    object
 10  adult_male   891 non-null    bool
 11  deck         891 non-null    category
 12  embark_town  891 non-null    object
 13  alive        891 non-null    object
 14  alone        891 non-null    bool
dtypes: bool(2), category(2), float64(2), int64(4), object(5)
memory usage: 80.7+ KB

titanic.survived.value_counts()
0    549
1    342
Name: survived, dtype: int64

import matplotlib.pyplot as plt
f, ax = plt.subplots(1, 2, figsize = (10, 5))
titanic['survived'][titanic['sex'] == 'male'].value_counts().plot.pie(explode = [0,0.1], autopct = '%1.1f%%', ax = ax[0], shadow = True)
titanic['survived'][titanic['sex'] == 'female'].value_counts().plot.pie(explode = [0,0.1], autopct = '%1.1f%%', ax = ax[1], shadow = True)
ax[0].set_title('Survived (Male)')
ax[1].set_title('Survived (Female)')
plt.show()
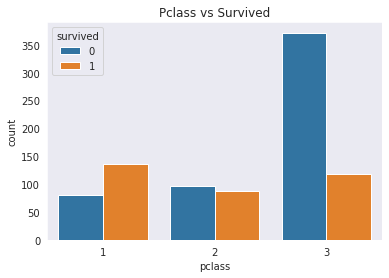
sns.countplot('pclass', hue = 'survived', data = titanic)
plt.title('Pclass vs Survived')
plt.show()
/usr/local/lib/python3.8/dist-packages/seaborn/_decorators.py:36: FutureWarning: Pass the following variable as a keyword arg: x. From version 0.12, the only valid positional argument will be `data`, and passing other arguments without an explicit keyword will result in an error or misinterpretation.
  warnings.warn(
데이터 모델링
titanic_corr = titanic.corr(method = 'pearson')
titanic_corr
titanic_corr.to_csv('titanic_corr.csv', index = False)

titanic['survived'].corr(titanic['adult_male'])
-0.5570800422053257

titanic['survived'].corr(titanic['fare'])
0.2573065223849625
결과 시각화
sns.pairplot(titanic, hue = 'survived')
ValueError: object arrays are not supported
sns.catplot(x = 'pclass', y = 'survived', hue = 'sex', data = titanic, kind = 'point')
plt.show
<function matplotlib.pyplot.show(*args, **kw)>
def category_age(x):
    if x < 10:
        return 0
    elif x < 20:
        return 1
    elif x < 30:
        return 2
    elif x < 40:
        return 3
    elif x < 50:
        return 4
    elif x < 60:
        return 5
    elif x < 70:
        return 6
    else:
        return 7
titanic['age2'] = titanic['age'].apply(category_age)
titanic['sex'] = titanic['sex'].map({'male':1, 'female':0})
titanic['family'] = titanic['sibsp'] + titanic['parch'] + 1
titanic.to_csv('titanic3.csv', index = False)
heatmap_data = titanic[['survived', 'sex', 'age2', 'family', 'pclass', 'fare']]
colormap = plt.cm.RdBu
sns.heatmap(heatmap_data.astype(float).corr(), linewidths = 0.1, vmax = 1.0, square = True, cmap = colormap, linecolor = 'white', annot = True, annot_kws = {"size": 10})
plt.show()
'Python > 데이터 과학 기반의 파이썬 빅데이터 분석(한빛 아카데미)' 카테고리의 다른 글
| 데이터 과학 기반의 파이썬 빅데이터 분석 Chapter09 지리 정보 분석 (0) | 2023.01.09 |
|---|---|
| 데이터 과학 기반의 파이썬 빅데이터 분석 Chapter08 텍스트 빈도 분석 (0) | 2023.01.08 |
| 데이터 과학 기반의 파이썬 빅데이터 분석 Chapter06 파이썬 크롤링 - 라이브러리 이용 (0) | 2023.01.06 |
| 데이터 과학 기반의 파이썬 빅데이터 분석 Chapter05 파이썬 크롤링-API 이용 (2) | 2023.01.05 |
| 데이터 과학 기반의 파이썬 빅데이터 분석 Chapter04 파이썬 프로그래밍 기초 연습문제 (0) | 2023.01.05 |


