01 [평균 군집화 분석 + 그래프] 타깃 마케팅을 위한 소비자 군집 분석하기
import pandas as pd
import math

retail_df = pd.read_excel('/content/Online_Retail.xlsx')
retail_df.head()
데이터 정제하기
retail_df.info()
<class 'pandas.core.frame.DataFrame'>
Int64Index: 536641 entries, 0 to 541908
Data columns (total 8 columns):
 #   Column       Non-Null Count   Dtype
---  ------       --------------   -----
 0   InvoiceNo    536641 non-null  object
 1   StockCode    536641 non-null  object
 2   Description  535187 non-null  object
 3   Quantity     536641 non-null  int64
 4   InvoiceDate  536641 non-null  datetime64[ns]
 5   UnitPrice    536641 non-null  float64
 6   CustomerID   401604 non-null  float64
 7   Country      536641 non-null  object
dtypes: datetime64[ns](1), float64(2), int64(1), object(4)
memory usage: 36.8+ MB

#오류 데이터 정제
retail_df = retail_df[retail_df['Quantity']>0]
retail_df = retail_df[retail_df['UnitPrice']>0]
retail_df = retail_df[retail_df['CustomerID'].notnull()]

#'CustomerID' 자료형을 정수형으로 변환
retail_df['CustomerID'] = retail_df['CustomerID'].astype(int)

retail_df.info()
print(retail_df.isnull().sum())
print(retail_df.shape)
<class 'pandas.core.frame.DataFrame'>
Int64Index: 392692 entries, 0 to 541908
Data columns (total 8 columns):
 #   Column       Non-Null Count   Dtype
---  ------       --------------   -----
 0   InvoiceNo    392692 non-null  object
 1   StockCode    392692 non-null  object
 2   Description  392692 non-null  object
 3   Quantity     392692 non-null  int64
 4   InvoiceDate  392692 non-null  datetime64[ns]
 5   UnitPrice    392692 non-null  float64
 6   CustomerID   392692 non-null  int64
 7   Country      392692 non-null  object
dtypes: datetime64[ns](1), float64(1), int64(2), object(4)
memory usage: 27.0+ MB
InvoiceNo      0
StockCode      0
Description    0
Quantity       0
InvoiceDate    0
UnitPrice      0
CustomerID     0
Country        0
dtype: int64
(392692, 8)

#중복 레코드 제거
retail_df.drop_duplicates(inplace = True)
print(retail_df.shape)  #작업 확인용 출력
(392692, 8)
데이터프레임의 칼럼 추출 및 분석용 데이터 생성하기
pd.DataFrame([{'Product':len(retail_df['StockCode'].value_counts()), 'Transaction':len(retail_df['InvoiceNo'].value_counts()),
               'Customer':len(retail_df['CustomerID'].value_counts())}], columns = ['Product', 'Transaction', 'Customer'], index = ['counts'])
retail_df['Country'].value_counts()
United Kingdom          349203
Germany                   9025
France                    8326
EIRE                      7226
Spain                     2479
Netherlands               2359
Belgium                   2031
Switzerland               1841
Portugal                  1453
Australia                 1181
Norway                    1071
Italy                      758
Channel Islands            747
Finland                    685
Cyprus                     603
Sweden                     450
Austria                    398
Denmark                    380
Poland                     330
Japan                      321
Israel                     245
Unspecified                241
Singapore                  222
Iceland                    182
USA                        179
Canada                     151
Greece                     145
Malta                      112
United Arab Emirates        68
European Community          60
RSA                         57
Lebanon                     45
Lithuania                   35
Brazil                      32
Czech Republic              25
Bahrain                     17
Saudi Arabia                 9
Name: Country, dtype: int64

#주문 금액 컬럼 추가
retail_df['SaleAmount'] = retail_df['UnitPrice']*retail_df['Quantity']
retail_df.head()    #작업 확인용 출력
aggregations = {
    'InvoiceNo':'count',
    'SaleAmount':'sum',
    'InvoiceDate':'max'
}

customer_df = retail_df.groupby('CustomerID').agg(aggregations)
customer_df = customer_df.reset_index()
customer_df.head()  #작업 확인용 출력
customer_df = customer_df.rename(columns = {'InvoiceNo':'Freq', 'InvoiceDate':'ElapsedDays'})
customer_df.head()  #작업 확인용 출력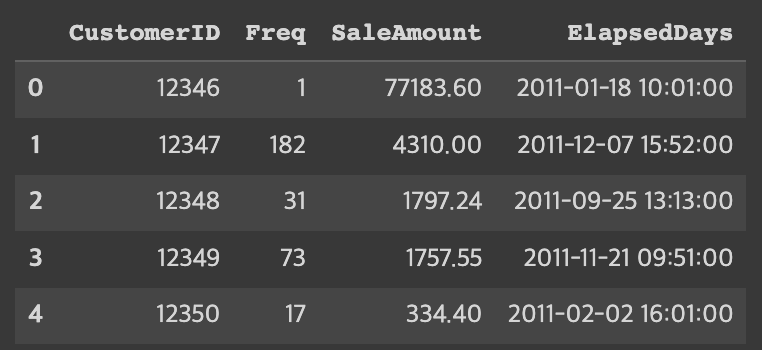
마지막 주문일로부터 며칠이 지났는지에 대한 값을 ElapsedDays 칼럼에 저장해야 한다. 이 값은 '기준 날짜 - 마지막 구매일'로 계산해 구한다. 분석 중인 데이터의 기준 날짜는 2011년 12월 10일이다.
import datetime

customer_df['ElapsedDays'] = datetime.datetime(2011,12,10) - customer_df['ElapsedDays']
customer_df.head()  #작업 확인용 출력
customer_df['ElapsedDays'] = customer_df['ElapsedDays'].apply(lambda x: x.days+1)
customer_df.head()  #작업 확인용 출력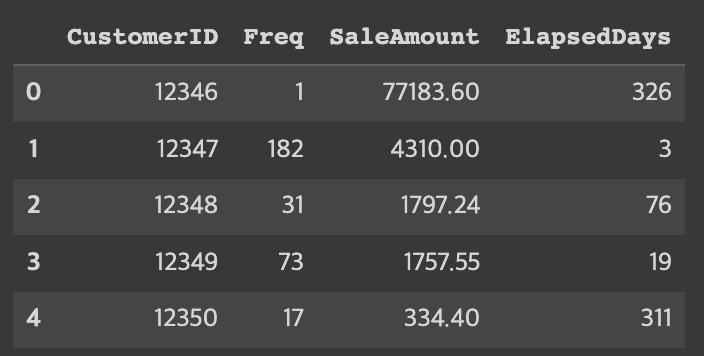
데이터 분포 조정하기
import matplotlib.pyplot as plt
import seaborn as sns

fig, ax = plt.subplots()
ax.boxplot([customer_df['Freq'], customer_df['SaleAmount'], customer_df['ElapsedDays']], sym = 'bo')
plt.xticks([1, 2, 3], ['Freq', 'SaleAmount', 'ElapsedDays'])
plt.show()
import numpy as np

customer_df['Freq_log'] = np.log1p(customer_df['Freq'])
customer_df['SaleAmount_log'] = np.log1p(customer_df['SaleAmount'])
customer_df['ElapsedDays_log'] = np.log1p(customer_df['ElapsedDays'])
customer_df.head()  #작업 확인용 출력
fig, ax = plt.subplots()
ax.boxplot([customer_df['Freq_log'], customer_df['SaleAmount_log'],
            customer_df['ElapsedDays_log']], sym = 'bo')
plt.xticks([1, 2, 3], ['Freq_log', 'SaleAmount_log', 'ElapsedDays_log'])
plt.show
<function matplotlib.pyplot.show(*args, **kw)>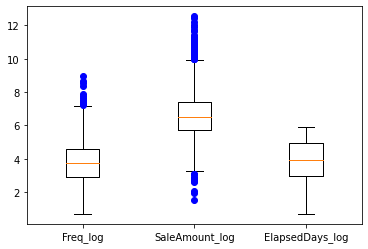
분석 모델 구축
K- 평균 군집화 모델을 이용하여 분석 모델 구축하기
X_features를 정규 분포로 스케일링하기
from sklearn.cluster import KMeans
from sklearn.metrics import silhouette_score, silhouette_samples

X_features = customer_df[['Freq_log', 'SaleAmount_log', 'ElapsedDays_log']].values

from sklearn.preprocessing import StandardScaler
X_features_scaled = StandardScaler().fit_transform(X_features)
엘보 방법으로 클러스트 개수 K 선택하기
distortions = []

for i in range(1, 11):
    kmeans_i = KMeans(n_clusters = i, random_state = 0) #모델 생성
    kmeans_i.fit(X_features_scaled)                     #모델 훈련
    distortions.append(kmeans_i.inertia_)

plt.plot(range(1, 11), distortions, marker = 'o')
plt.xlabel('Number of clusters')
plt.ylabel('Distortion')
plt.show()
kmeans = KMeans(n_clusters=3, random_state=0)    #모델 생성
#모델 학습과 결과 예측(클러스터 레이블 생성)
Y_labels = kmeans.fit_predict(X_features_scaled)

customer_df['ClusterLabel'] = Y_labels
customer_df.head()  #작업 확인용 출력
결과 분석 및 시각화
클러스터의 비중과 데이터 분포를 차트로 시각화하기
from matplotlib import cm
import matplotlib.pyplot as plt

def silhouetteViz(n_cluster, X_features):
    kmeans = KMeans(n_clusters = n_cluster, random_state = 0)
    Y_labels = kmeans.fit_predict(X_features)

    silhouette_values = silhouette_samples(X_features, Y_labels, metric = 'euclidean')

    y_ax_lower, y_ax_upper = 0, 0
    y_ticks = []

    for c in range(n_cluster):
        c_silhouettes = silhouette_values[Y_labels == c]
        c_silhouettes.sort()
        y_ax_upper += len(c_silhouettes)
        color = cm.jet(float(c) / n_cluster)
        plt.barh(range(y_ax_lower, y_ax_upper), c_silhouettes, height = 1.0, edgecolor = 'none', color = color)
        y_ticks.append((y_ax_lower + y_ax_upper) / 2.)
        y_ax_lower += len(c_silhouettes)

    silhouette_avg = np.mean(silhouette_values)
    plt.axvline(silhouette_avg, color = 'red', linestyle = '--')
    plt.title('Number of Cluster : '+ str(n_cluster) + '\n \ '+ 'Silhouette Score : '+ str(round(silhouette_avg,3)))
    plt.yticks(y_ticks, range(n_cluster))
    plt.xticks([0, 0.2, 0.4, 0.6, 0.8, 1])
    plt.ylabel('Cluster')
    plt.xlabel('Silhouette coefficient')
    plt.tight_layout()
    plt.show()
클러스터의 데이터 분포를 확인하기 위해 스캐터 차트로 시각화한다.
def clusterScatter(n_cluster, X_features):
    c_colors = []
    kmeans = KMeans(n_clusters = n_cluster, random_state = 0)
    Y_labels = kmeans.fit_predict(X_features)

    for i in range(n_cluster):
        c_color = cm.jet(float(i) / n_cluster)  #클러스터의 색상 설정
        c_colors.append(c_color)
        #클러스터의 데이터 분포를 동그라미로 시각화
        plt.scatter(X_features[Y_labels == i,0], X_features[Y_labels == i,1], marker = 'o',
                    color = c_color, edgecolor = 'black', s = 50, label = 'cluster '+ str(i))

    #각 클러스터의 중심점을 삼각형으로 표시
    for i in range(n_cluster):
        plt.scatter(kmeans.cluster_centers_[i,0], kmeans.cluster_centers_[i,1], marker = '^',
                    color = c_colors[i], edgecolor = 'w', s = 200)
        plt.legend()
        plt.grid()
        plt.tight_layout()
        plt.show()
데이터 분포를 시각화하여 비교해보자.
silhouetteViz(3, X_features_scaled)
silhouetteViz(4, X_features_scaled)
silhouetteViz(5, X_features_scaled)
silhouetteViz(6, X_features_scaled)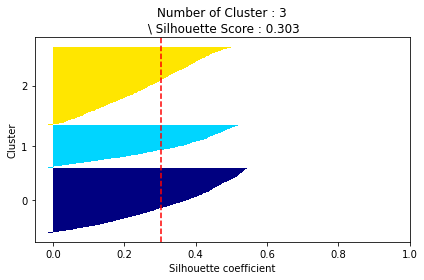
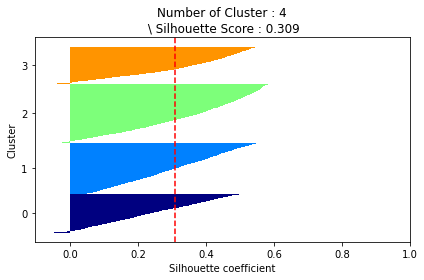

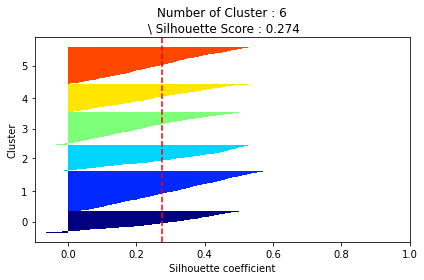
클러스터 분포를 이용하여 최적의 클러스터 수를 확인한다.
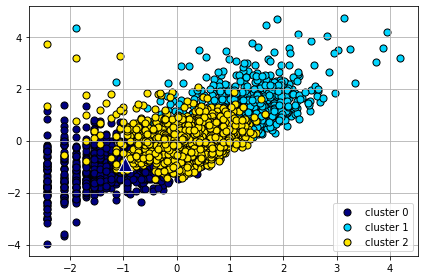
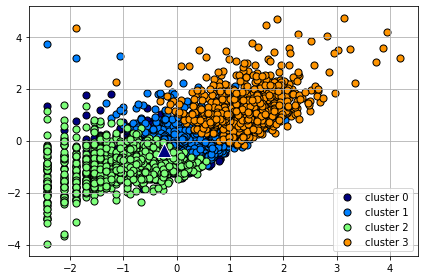
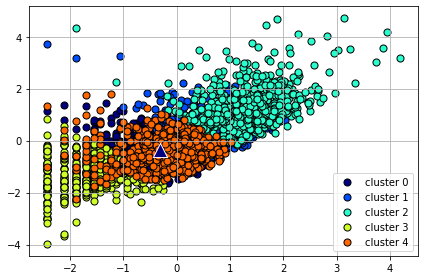
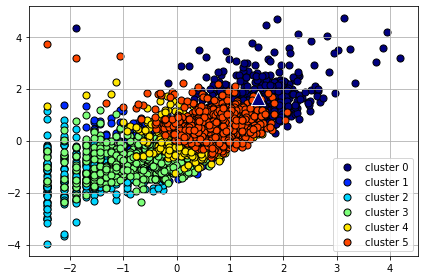
최종적으로 최적의 클러스터 k를 4로 결정하자.
best_cluster = 4
kmeans = KMeans(n_clusters = best_cluster, random_state = 0)
Y_labels = kmeans.fit_predict(X_features_scaled)

customer_df['ClusterLabel'] = Y_labels
customer_df.head()
customer_df.to_csv('Online_Retail_Customer_Cluster.csv')추가 분석하기
customer_df.groupby('ClusterLabel')['CustomerID'].count()
ClusterLabel
0     891
1    1207
2    1368
3     872
Name: CustomerID, dtype: int64
고객 클러스터에서 총 구매 빈도, 총 구매 금액, 마지막 구매 이후 경과일 정보 추출하고, 구매 1회당 평균 구매 금액도 계산해 보자.
customer_cluster_df = customer_df.drop(['Freq_log', 'SaleAmount_log', 'ElapsedDays_log'],axis = 1, inplace = False)

#주문 1회당 평균 구매금액: SaleAmountAvg
customer_cluster_df['SaleAmountAvg'] = customer_cluster_df['SaleAmount']/customer_cluster_df['Freq']
customer_cluster_df.head()
customer_cluster_df.drop(['CustomerID'], axis = 1, inplace = False).groupby('ClusterLabel').mean()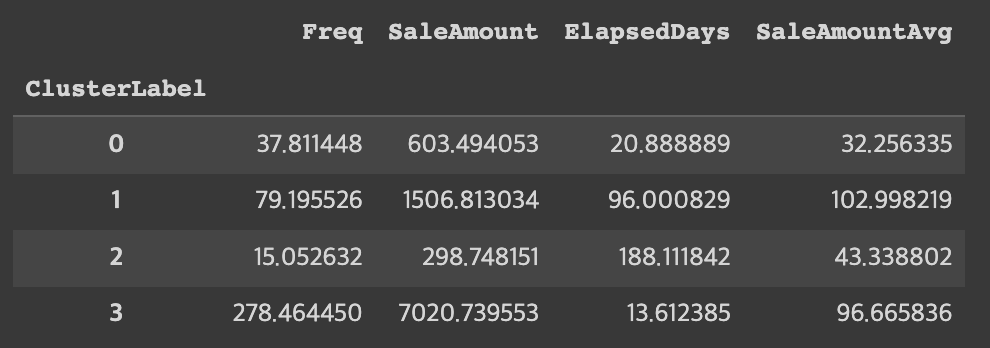
'Python > 데이터 과학 기반의 파이썬 빅데이터 분석(한빛 아카데미)' 카테고리의 다른 글
| 데이터 과학 기반의 파이썬 빅데이터 분석 Chapter13 텍스트 마이닝 (2) | 2023.01.11 |
|---|---|
| 데이터 과학 기반의 파이썬 빅데이터 분석 Chapter11 분류 분석 (0) | 2023.01.10 |
| 데이터 과학 기반의 파이썬 빅데이터 분석 Chapter10 회귀 분석 (0) | 2023.01.09 |
| 데이터 과학 기반의 파이썬 빅데이터 분석 Chapter09 지리 정보 분석 (0) | 2023.01.09 |
| 데이터 과학 기반의 파이썬 빅데이터 분석 Chapter08 텍스트 빈도 분석 (0) | 2023.01.08 |


