Step 0. 의료 데이터셋에 대하여
의료 데이터(바이오 데이터)를 갖고, 실제 분석하여 모델링하는 직무가 늘고 있는 추세입니다.
의료 영상(MRI, CT), 진료기록, 병원 공실률, 연구자료 등의 의료 빅데이터들이 전 세계적으로 활성화되어 있습니다.
| TP | FP |
| FN | TN |
정밀도 = TP / TP+FP ※ 예측시 옳을 확률
재현율 = TP / TP+FN ※ 실제 True 중 얼마나 맞췄는지에 대한 확률
Step 1. 데이터셋 준비하기
# 사용할 라이브러리 출력
import pandas as pd
import numpy as np
import matplotlib.pyplot as plt
import seaborn as sns
Colab Notebook에 Kaggle API 세팅하기
# Kaggle user id, Key 세팅하기
import os

os.environ['KAGGLE_USERNAME'] = 'jhighllight'
os.environ['KAGGLE_KEY'] = 'xxxxxxxxxxxxxxxxxxxxxxxx'
데이터 다운로드 및 압축 해제하기
# Linux 명령어로 Kaggle API를 이용하여 데이터셋 다운로드하기 (!kaggle ~)
!kaggle datasets download -d andrewmvd/heart-failure-clinical-data

Downloading heart-failure-clinical-data.zip to /content
  0% 0.00/3.97k [00:00<?, ?B/s]
100% 3.97k/3.97k [00:00<00:00, 2.96MB/s]


!ls

heart-failure-clinical-data.zip  sample_data
Pandas 라이브러리로 csv파일 읽어 들이기
# 데이터프레임 csv파일 불러오기
df = pd.read_csv('/content/sample_data/heart_failure_clinical_records_dataset.csv')
Step 2. EDA 및 데이터 기초 통계 분석
데이터프레임의 각 칼럼 분석하기
df.head()
df.info()

<class 'pandas.core.frame.DataFrame'>
RangeIndex: 299 entries, 0 to 298
Data columns (total 13 columns):
 #   Column                    Non-Null Count  Dtype
---  ------                    --------------  -----
 0   age                       299 non-null    float64
 1   anaemia                   299 non-null    int64
 2   creatinine_phosphokinase  299 non-null    int64
 3   diabetes                  299 non-null    int64
 4   ejection_fraction         299 non-null    int64
 5   high_blood_pressure       299 non-null    int64
 6   platelets                 299 non-null    float64
 7   serum_creatinine          299 non-null    float64
 8   serum_sodium              299 non-null    int64
 9   sex                       299 non-null    int64
 10  smoking                   299 non-null    int64
 11  time                      299 non-null    int64
 12  DEATH_EVENT               299 non-null    int64
dtypes: float64(3), int64(10)
memory usage: 30.5 KB
df.describe()
수치형 데이터의 히스토그램 그리기
# seaborn의 histplot, jointplot을 이용해 히스토그램 그리기
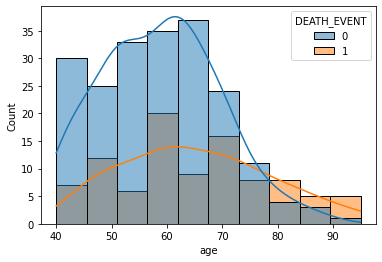
sns.histplot(x='age', data=df, hue='DEATH_EVENT', kde=True)
<AxesSubplot:xlabel='age', ylabel='Count'>
sns.histplot(data=df.loc[df['creatinine_phosphokinase'] < 3000, 'creatinine_phosphokinase'])<AxesSubplot:xlabel='creatinine_phosphokinase', ylabel='Count'>

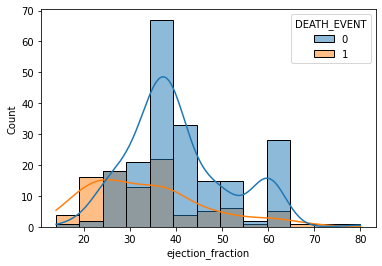
sns.histplot(x='ejection_fraction', data=df, bins=13, hue='DEATH_EVENT', kde=True)<AxesSubplot:xlabel='ejection_fraction', ylabel='Count'>
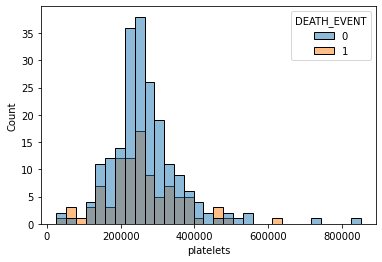
sns.histplot(x='platelets', data=df, hue='DEATH_EVENT')<AxesSubplot:xlabel='platelets', ylabel='Count'>
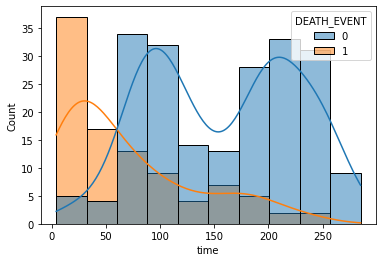
sns.histplot(x='time', data=df, hue='DEATH_EVENT', kde=True)<AxesSubplot:xlabel='time', ylabel='Count'>
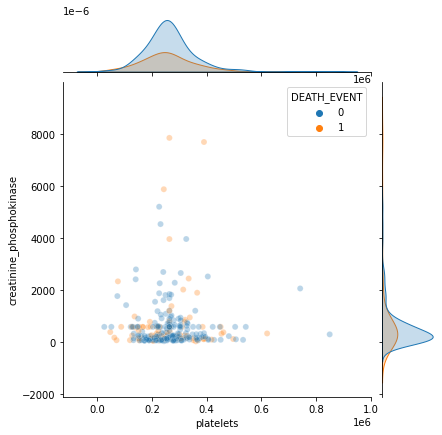
sns.jointplot(x='platelets', y='creatinine_phosphokinase', hue='DEATH_EVENT', data=df, alpha=0.3)<seaborn.axisgrid.JointGrid at 0x7 f7 eaa9 dd190>
Boxplot 계열을 이용하여 범주별 통계 확인하기
# seaborn의 Boxplot 계열(boxplot(), violinplot(), swarmplot())을 사용
# Hint) hue 키워드를 사용하여 범주 세분화 가능
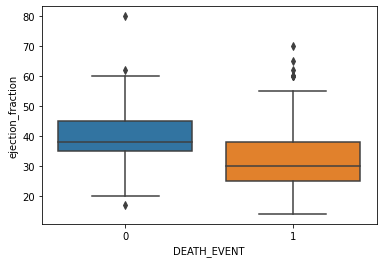
sns.boxplot(x='DEATH_EVENT', y='ejection_fraction', data=df)
<AxesSubplot:xlabel='DEATH_EVENT', ylabel='ejection_fraction'>
sns.boxplot(x='smoking', y='ejection_fraction', data=df)<AxesSubplot:xlabel='smoking', ylabel='ejection_fraction'>

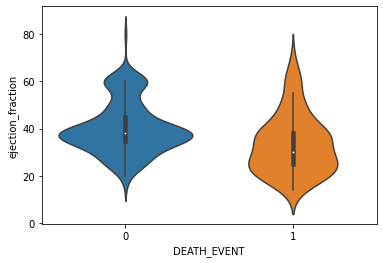
sns.violinplot(x='DEATH_EVENT', y='ejection_fraction', data=df)<AxesSubplot:xlabel='DEATH_EVENT', ylabel='ejection_fraction'>
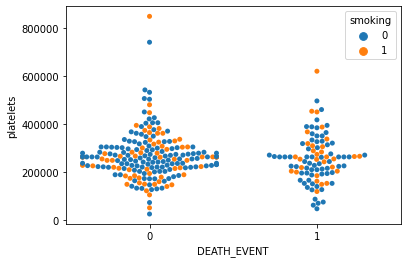
sns.swarmplot(x='DEATH_EVENT', y='platelets', hue='smoking', data=df)

/usr/local/lib/python3.8/dist-packages/seaborn/categorical.py:1296: UserWarning: 9.9% of the points cannot be placed; you may want to decrease the size of the markers or use stripplot.
  warnings.warn(msg, UserWarning)
<AxesSubplot:xlabel='DEATH_EVENT', ylabel='platelets'>
Step 3. 모델 학습을 위한 데이터 전처리
StandardScaler를 이용하여 데이터 전처리하기
from sklearn.preprocessing import StandardScaler

df.columns
Index(['age', 'anaemia', 'creatinine_phosphokinase', 'diabetes',
'ejection_fraction', 'high_blood_pressure', 'platelets',
'serum_creatinine', 'serum_sodium', 'sex', 'smoking', 'time',
'DEATH_EVENT'],
dtype='object')
# 수치형 입력 데이터, 범주형 입력 데이터, 출력 데이터로 구분하기
X_num = df[['age', 'creatinine_phosphokinase', 'ejection_fraction', 'platelets', 'serum_creatinine', 'serum_sodium']]
X_cat = df[['anaemia', 'diabetes', 'high_blood_pressure', 'sex', 'smoking']]
y = df['DEATH_EVENT']
# 수치형 입력 데이터를 전처리하고, 입력 데이터 통합하기
scaler = StandardScaler()
scaler.fit(X_num)
X_scaled = scaler.transform(X_num)
X_scaled = pd.DataFrame(data=X_scaled, index=X_num.index, columns=X_num.columns)
X = pd.concat([X_scaled, X_cat], axis=1)X.head()
학습데이터와 테스트데이터 분리하기
from sklearn.model_selection import train_test_split

# train_test_split() 함수로 학습 데이터와 테스트 데이터 분리하기
X_train, X_test, y_train, y_test = train_test_split(X, y, test_size=0.3, random_state=1)
Step 4. Classification 모델 학습하기
Logistic Regression 모델 생성/학습하기
from sklearn.linear_model import LogisticRegression

# LogisticRegression 모델 생성/학습
model_lr = LogisticRegression(max_iter=1000)
model_lr.fit(X_train, y_train)
모델 학습 결과 평가하기
from sklearn.metrics import classification_report

# Predict를 수행하고 classification_report() 결과 출력하기
pred = model_lr.predict(X_test)
print(classification_report(y_test, pred))
XGBoost 모델 생성/학습하기
from xgboost import XGBClassifier

# XGBClassifier 모델 생성/학습
model_xgb = XGBClassifier()
model_xgb.fit(X_train, y_train)
모델 학습 결과 평가하기
# Predict를 수행하고 classification_report() 결과 출력하기
pred = model_xgb.predict(X_test)
print(classification_report(y_test, pred))
특징의 중요도 확인하기
# XGBClassifier 모델의 feature_importances_를 이용하여 중요도 plot
plt.bar(X.columns, model_xgb.feature_importances_)
plt.xticks(rotation=90)
plt.show()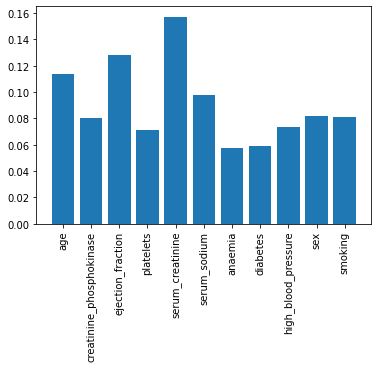
Step 5. 모델 학습 결과 심화 분석하기
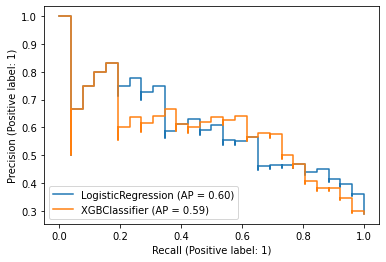
Precision-Recall 커브 확인하기
from sklearn.metrics import PrecisionRecallDisplay

# 두 모델의 Precision-Recall 커브를 한번에 그리기 (힌트: fig.gca()로 ax를 반환받아 사용)
fig = plt.figure()
ax = fig.gca()
PrecisionRecallDisplay.from_estimator(model_lr, X_test, y_test, ax=ax)
PrecisionRecallDisplay.from_estimator(model_xgb, X_test, y_test, ax=ax)
<sklearn.metrics._plot.precision_recall_curve.PrecisionRecallDisplay at 0x7 f6 ba304 c6 d0>
ROC 커브 확인하기
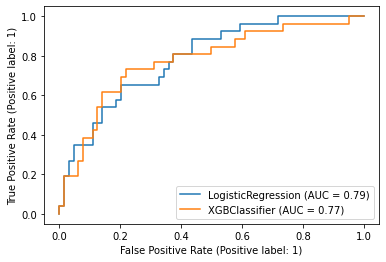
from sklearn.metrics import RocCurveDisplay

# 두 모델의 ROC 커브를 한번에 그리기 (힌트: fig.gca()로 ax를 반환받아 사용)
fig = plt.figure()
ax = fig.gca()
RocCurveDisplay.from_estimator(model_lr, X_test, y_test, ax=ax)
RocCurveDisplay.from_estimator(model_xgb, X_test, y_test, ax=ax)
/usr/local/lib/python3.8/dist-packages/sklearn/utils/deprecation.py:87: FutureWarning: Function plot_roc_curve is deprecated; Function :func:`plot_roc_curve` is deprecated in 1.0 and will be removed in 1.2. Use one of the class methods: :meth:`sklearn.metric.RocCurveDisplay.from_predictions` or :meth:`sklearn.metric.RocCurveDisplay.from_estimator`.
warnings.warn(msg, category=FutureWarning)
/usr/local/lib/python3.8/dist-packages/sklearn/utils/deprecation.py:87: FutureWarning: Function plot_roc_curve is deprecated; Function :func:`plot_roc_curve` is deprecated in 1.0 and will be removed in 1.2. Use one of the class methods: :meth:`sklearn.metric.RocCurveDisplay.from_predictions` or :meth:`sklearn.metric.RocCurveDisplay.from_estimator`.
warnings.warn(msg, category=FutureWarning)
'Python > Kaggle' 카테고리의 다른 글
| Part1. Chapter 04 - 오늘 밤 유럽 축구, 어디가 이길까_ 데이터로 분석하고 내기르.. (0) | 2023.03.09 |
|---|---|
| Part1. Chapter 03 - 롤(LOL) 좀 하니_ 이것만 하면 무조건 이긴다! (0) | 2023.03.07 |
| Part1. Chapter 02 - 우리 애는 머리는 좋은데, 공부를 안해서 그래요 (2) | 2023.03.07 |
| Kaggle 데이터 셋 다운로드 방법 (0) | 2023.03.03 |
| Colab Notebook에 Kaggle API 세팅하는 방법 (0) | 2023.03.02 |


