Used Cars Dataset
Vehicles listings from Craigslist.org
www.kaggle.com
Step 1. 데이터셋 준비하기
import pandas as pd
import numpy as np
import matplotlib.pyplot as plt
import seaborn as sns
Colab Notebook에 Kaggle API 세팅하기
import os
# os.environ을 이용하여 Kaggle API Username, Key 세팅하기
os.environ['KAGGLE_USERNAME'] = 'jhighllight'
os.environ['KAGGLE_KEY'] = 'xxxxxxxxxxxxxxxxxxxxx'
데이터 다운로드 및 압축 해제하기
# Linux 명령어로 Kaggle API를 이용하여 데이터셋 다운로드하기 (!kaggle ~)
# Linux 명령어로 압축 해제하기
!kaggle datasets download -d austinreese/craigslist-carstrucks-data
!unzip '*.zip'
Downloading craigslist-carstrucks-data.zip to /content
95% 249M/262M [00:01 <00:00, 194MB/s]
100% 262M/262M [00:01<00:00, 169MB/s]
Archive: craigslist-carstrucks-data.zip
inflating: vehicles.csv
Pandas 라이브러리로 csv파일 읽어 들이기
df = pd.read_csv('/content/vehicles.csv')Step 2. EDA 및 데이터 기초 통계 분석
불필요한 데이터 데이터프레임에서 제거하기
# DataFrame에서 제공하는 메소드를 이용하여 각 데이터프레임의 구조 분석하기 (head(), info(), describe())
# 데이터프레임에서 불필요한 컬럼 제거하기
df.head()
df.info()<class 'pandas.core.frame.DataFrame'>
RangeIndex: 426880 entries, 0 to 426879
Data columns (total 26 columns):
# Column Non-Null Count Dtype
--- ------ -------------- -----
0 id 426880 non-null int64
1 url 426880 non-null object
2 region 426880 non-null object
3 region_url 426880 non-null object
4 price 426880 non-null int64
5 year 425675 non-null float64
6 manufacturer 409234 non-null object
7 model 421603 non-null object
8 condition 252776 non-null object
9 cylinders 249202 non-null object
10 fuel 423867 non-null object
11 odometer 422480 non-null float64
12 title_status 418638 non-null object
13 transmission 424324 non-null object
14 VIN 265838 non-null object
15 drive 296313 non-null object
16 size 120519 non-null object
17 type 334022 non-null object
18 paint_color 296677 non-null object
19 image_url 426812 non-null object
20 description 426810 non-null object
21 county 0 non-null float64
22 state 426880 non-null object
23 lat 420331 non-null float64
24 long 420331 non-null float64
25 posting_date 426812 non-null object
dtypes: float64(5), int64(2), object(19)
memory usage: 84.7+ MB
df.isna().sum()id 0
url 0
region 0
region_url 0
price 0
year 1205
manufacturer 17646
model 5277
condition 174104
cylinders 177678
fuel 3013
odometer 4400
title_status 8242
transmission 2556
VIN 161042
drive 130567
size 306361
type 92858
paint_color 130203
image_url 68
description 70
county 426880
state 0
lat 6549
long 6549
posting_date 68
dtype: int64
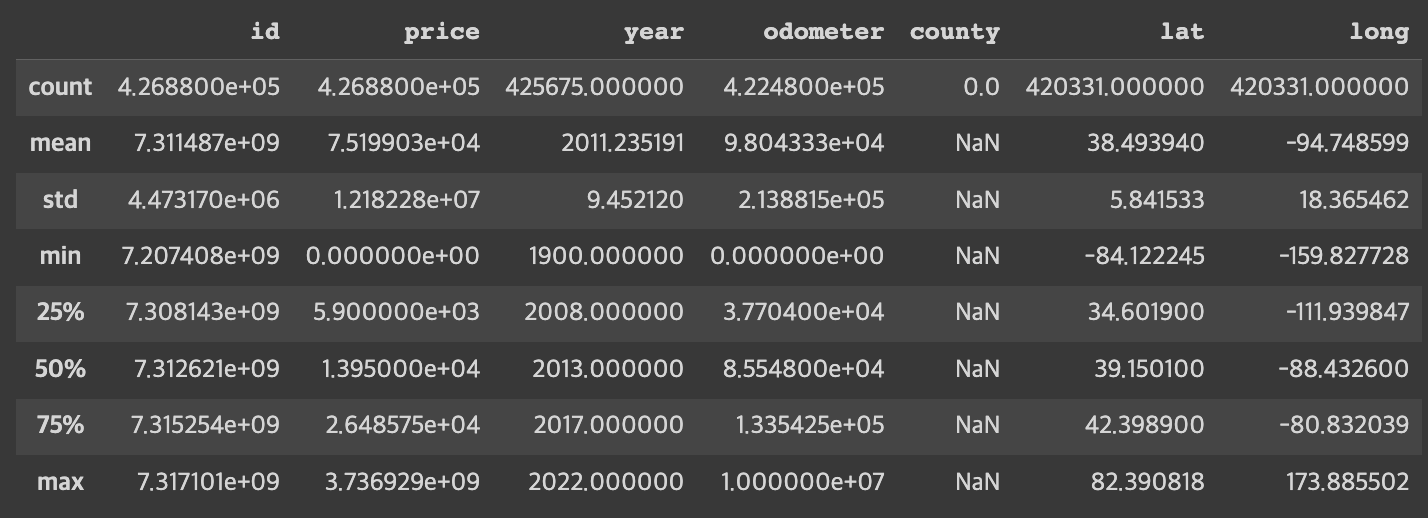
df.describe()
df.columnsIndex(['id', 'url', 'region', 'region_url', 'price', 'year', 'manufacturer',
'model', 'condition', 'cylinders', 'fuel', 'odometer', 'title_status',
'transmission', 'VIN', 'drive', 'size', 'type', 'paint_color',
'image_url', 'description', 'county', 'state', 'lat', 'long',
'posting_date'],
dtype='object')
df.drop(['id', 'url', 'region_url', 'VIN',
       'image_url', 'description', 'county', 'state', 'lat',
       'long', 'posting_date'], axis=1, inplace=True)
df['age'] = 2022 - df['year']
df.drop('year', axis=1, inplace=True)
df
범주형 데이터의 통계 분석하기
df.columnsIndex(['region', 'price', 'manufacturer', 'model', 'condition', 'cylinders',
'fuel', 'odometer', 'title_status', 'transmission', 'drive', 'size',
'type', 'paint_color', 'age'],
dtype='object')
# 범주형 데이터의 값의 범위, 기초 통계 분석하기
len(df['manufacturer'].value_counts())
42
df['manufacturer'].value_counts()ford 70985
chevrolet 55064
toyota 34202
honda 21269
nissan 19067
jeep 19014
ram 18342
gmc 16785
bmw 14699
dodge 13707
mercedes-benz 11817
hyundai 10338
subaru 9495
volkswagen 9345
kia 8457
lexus 8200
audi 7573
cadillac 6953
chrysler 6031
acura 5978
buick 5501
mazda 5427
infiniti 4802
lincoln 4220
volvo 3374
mitsubishi 3292
mini 2376
pontiac 2288
rover 2113
jaguar 1946
porsche 1384
mercury 1184
saturn 1090
alfa-romeo 897
tesla 868
fiat 792
harley-davidson 153
ferrari 95
datsun 63
aston-martin 24
land rover 21
morgan 3
Name: manufacturer, dtype: int64
fig = plt.figure(figsize=(8, 10))
sns.countplot(y='manufacturer', data=df.fillna('n/a'), order=df.fillna('n/a')['manufacturer'].value_counts().index)
<Axes: xlabel='count', ylabel='manufacturer'>

df.columnsIndex(['region', 'price', 'manufacturer', 'model', 'condition', 'cylinders',
'fuel', 'odometer', 'title_status', 'transmission', 'drive', 'size',
'type', 'paint_color', 'age'],
dtype='object')
df['model'].value_counts()f-150 8009
silverado 1500 5140
1500 4211
camry 3135
silverado 3023
...
Huyndai Sante Fe Limited 1
astro awd 4x4 1
escalade and 1
cx 3 1
Paige Glenbrook Touring 1
Name: model, Length: 29667, dtype: int64
for model, num in zip(df['model'].value_counts().index, df['model'].value_counts()):
    print(model, num)
스트리밍 출력 내용이 길어서 마지막 5000줄이 삭제되었습니다.
Hudson Terraplane 1
f250 super cab short bed 1
c20 step side pickup 1
Scripps-Booth Model C 1
- PEARL WHITE HYBRID - 49 MPG 1
1966 Volkswagan Convertible Bug 1
Poniac grand am 1
vega panel 1
3500 1 ton dually 4x4 1
.
.
.
sportgage 1
Toyta xamry 1
g35xsports 1
escalade ext awd gas 1
big horn slt 1
1500 4x4 sport 1
capri xr2 1
Huyndai Sante Fe Limited 1
astro awd 4x4 1
escalade and 1
cx 3 1
Paige Glenbrook Touring 1
fig = plt.figure(figsize=(8, 10))
sns.countplot(y='model', data=df.fillna('n/a'), order=df.fillna('n/a')['model'].value_counts().index)
<Axes: xlabel='count', ylabel='model'>/usr/local/lib/python3.9/dist-packages/IPython/core/events.py:88: UserWarning: Glyph 128665 (\N {RECREATIONAL VEHICLE}) missing from current font.
func(*args, **kwargs)
/usr/local/lib/python3.9/dist-packages/IPython/core/events.py:88: UserWarning: Glyph 120028 (\N{MATHEMATICAL BOLD SCRIPT CAPITAL M}) missing from current font.
func(*args, **kwargs)
/usr/local/lib/python3.9/dist-packages/IPython/core/events.py:88: UserWarning: Glyph 120046 (\N{MATHEMATICAL BOLD SCRIPT SMALL E}) missing from current font.
func(*args, **kwargs)
/usr/local/lib/python3.9/dist-packages/IPython/core/events.py:88: UserWarning: Glyph 120059 (\N{MATHEMATICAL BOLD SCRIPT SMALL R}) missing from current font.
func(*args, **kwargs)
/usr/local/lib/python3.9/dist-packages/IPython/core/events.py:88: UserWarning: Glyph 120044 (\N{MATHEMATICAL BOLD SCRIPT SMALL C}) missing from current font.
func(*args, **kwargs)
/usr/local/lib/python3.9/dist-packages/IPython/core/events.py:88: UserWarning: Glyph 120045 (\N{MATHEMATICAL BOLD SCRIPT SMALL D}) missing from current font.
func(*args, **kwargs)
/usr/local/lib/python3.9/dist-packages/IPython/core/events.py:88: UserWarning: Glyph 120060 (\N{MATHEMATICAL BOLD SCRIPT SMALL S}) missing from current font.
func(*args, **kwargs)
/usr/local/lib/python3.9/dist-packages/IPython/core/events.py:88: UserWarning: Glyph 120043 (\N{MATHEMATICAL BOLD SCRIPT SMALL B}) missing from current font.
func(*args, **kwargs)
/usr/local/lib/python3.9/dist-packages/IPython/core/events.py:88: UserWarning: Glyph 120055 (\N{MATHEMATICAL BOLD SCRIPT SMALL N}) missing from current font.
func(*args, **kwargs)
/usr/local/lib/python3.9/dist-packages/IPython/core/events.py:88: UserWarning: Glyph 120067 (\N{MATHEMATICAL BOLD SCRIPT SMALL Z}) missing from current font.
func(*args, **kwargs)
/usr/local/lib/python3.9/dist-packages/IPython/core/events.py:88: UserWarning: Glyph 120054 (\N{MATHEMATICAL BOLD SCRIPT SMALL M}) missing from current font.
func(*args, **kwargs)
/usr/local/lib/python3.9/dist-packages/IPython/core/events.py:88: UserWarning: Glyph 120053 (\N{MATHEMATICAL BOLD SCRIPT SMALL L}) missing from current font.
func(*args, **kwargs)
/usr/local/lib/python3.9/dist-packages/IPython/core/events.py:88: UserWarning: Glyph 128293 (\N{FIRE}) missing from current font.
func(*args, **kwargs)
/usr/local/lib/python3.9/dist-packages/IPython/core/events.py:88: UserWarning: Glyph 127775 (\N{GLOWING STAR}) missing from current font.
func(*args, **kwargs)
/usr/local/lib/python3.9/dist-packages/IPython/core/pylabtools.py:128: UserWarning: Glyph 128665 (\N{RECREATIONAL VEHICLE}) missing from current font.
fig.canvas.print_figure(bytes_io, **kw)
/usr/local/lib/python3.9/dist-packages/IPython/core/pylabtools.py:128: UserWarning: Glyph 120028 (\N{MATHEMATICAL BOLD SCRIPT CAPITAL M}) missing from current font.
fig.canvas.print_figure(bytes_io, **kw)
/usr/local/lib/python3.9/dist-packages/IPython/core/pylabtools.py:128: UserWarning: Glyph 120046 (\N{MATHEMATICAL BOLD SCRIPT SMALL E}) missing from current font.
fig.canvas.print_figure(bytes_io, **kw)
/usr/local/lib/python3.9/dist-packages/IPython/core/pylabtools.py:128: UserWarning: Glyph 120059 (\N{MATHEMATICAL BOLD SCRIPT SMALL R}) missing from current font.
fig.canvas.print_figure(bytes_io, **kw)
/usr/local/lib/python3.9/dist-packages/IPython/core/pylabtools.py:128: UserWarning: Glyph 120044 (\N{MATHEMATICAL BOLD SCRIPT SMALL C}) missing from current font.
fig.canvas.print_figure(bytes_io, **kw)
/usr/local/lib/python3.9/dist-packages/IPython/core/pylabtools.py:128: UserWarning: Glyph 120045 (\N{MATHEMATICAL BOLD SCRIPT SMALL D}) missing from current font.
fig.canvas.print_figure(bytes_io, **kw)
/usr/local/lib/python3.9/dist-packages/IPython/core/pylabtools.py:128: UserWarning: Glyph 120060 (\N{MATHEMATICAL BOLD SCRIPT SMALL S}) missing from current font.
fig.canvas.print_figure(bytes_io, **kw)
/usr/local/lib/python3.9/dist-packages/IPython/core/pylabtools.py:128: UserWarning: Glyph 120043 (\N{MATHEMATICAL BOLD SCRIPT SMALL B}) missing from current font.
fig.canvas.print_figure(bytes_io, **kw)
/usr/local/lib/python3.9/dist-packages/IPython/core/pylabtools.py:128: UserWarning: Glyph 120055 (\N{MATHEMATICAL BOLD SCRIPT SMALL N}) missing from current font.
fig.canvas.print_figure(bytes_io, **kw)
/usr/local/lib/python3.9/dist-packages/IPython/core/pylabtools.py:128: UserWarning: Glyph 120067 (\N{MATHEMATICAL BOLD SCRIPT SMALL Z}) missing from current font.
fig.canvas.print_figure(bytes_io, **kw)
/usr/local/lib/python3.9/dist-packages/IPython/core/pylabtools.py:128: UserWarning: Glyph 120054 (\N{MATHEMATICAL BOLD SCRIPT SMALL M}) missing from current font.
fig.canvas.print_figure(bytes_io, **kw)
/usr/local/lib/python3.9/dist-packages/IPython/core/pylabtools.py:128: UserWarning: Glyph 120053 (\N{MATHEMATICAL BOLD SCRIPT SMALL L}) missing from current font.
fig.canvas.print_figure(bytes_io, **kw)
/usr/local/lib/python3.9/dist-packages/IPython/core/pylabtools.py:128: UserWarning: Glyph 128293 (\N{FIRE}) missing from current font.
fig.canvas.print_figure(bytes_io, **kw)
/usr/local/lib/python3.9/dist-packages/IPython/core/pylabtools.py:128: UserWarning: Glyph 127775 (\N{GLOWING STAR}) missing from current font.

sns.countplot(y='condition', data=df.fillna('n/a'), order=df.fillna('n/a')['condition'].value_counts().index)<Axes: xlabel='count', ylabel='condition'>

sns.countplot(y='cylinders', data=df.fillna('n/a'), order=df.fillna('n/a')['cylinders'].value_counts().index)<Axes: xlabel='count', ylabel='cylinders'>

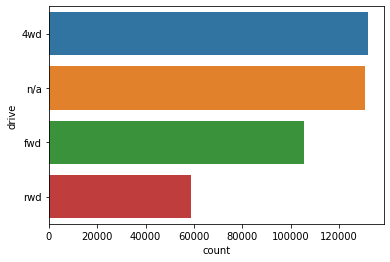
sns.countplot(y='fuel', data=df.fillna('n/a'), order=df.fillna('n/a')['fuel'].value_counts().index)<Axes: xlabel='count', ylabel='fuel'>

df.columnsIndex(['region', 'price', 'manufacturer', 'model', 'condition', 'cylinders',
'fuel', 'odometer', 'title_status', 'transmission', 'drive', 'size',
'type', 'paint_color', 'age'],
dtype='object')
sns.countplot(y='transmission', data=df.fillna('n/a'), order=df.fillna('n/a')['transmission'].value_counts().index)<Axes: xlabel='count', ylabel='transmission'>

sns.countplot(y='size', data=df.fillna('n/a'), order=df.fillna('n/a')['size'].value_counts().index)<Axes: xlabel='count', ylabel='size'>

sns.countplot(y='type', data=df.fillna('n/a'), order=df.fillna('n/a')['type'].value_counts().index)<Axes: xlabel='count', ylabel='type'>

sns.countplot(y='paint_color', data=df.fillna('n/a'), order=df.fillna('n/a')['paint_color'].value_counts().index)<Axes: xlabel='count', ylabel='paint_color'>

수치형 데이터의 통계 분석하기
df.columnsIndex(['region', 'price', 'manufacturer', 'model', 'condition', 'cylinders',
'fuel', 'odometer', 'title_status', 'transmission', 'drive', 'size',
'type', 'paint_color', 'age'],
dtype='object')
# 수치형 데이터의 값의 범위, 기초 통계 분석하기
fig = plt.figure(figsize=(8, 2))
sns.rugplot(x='price', data=df, height=1)
<Axes: xlabel='price'>

fig = plt.figure(figsize=(8, 2))
sns.rugplot(x='odometer', data=df, height=1)
<Axes: xlabel='odometer'>

sns.histplot(x='age', data=df, bins=18, kde=True)<Axes: xlabel='age', ylabel='Count'>

Step 3. 데이터 클리닝 수행하기
범주형 데이터 시각화하여 분석하기
df.columnsIndex(['region', 'price', 'manufacturer', 'model', 'condition', 'cylinders',
'fuel', 'odometer', 'title_status', 'transmission', 'drive', 'size',
'type', 'paint_color', 'age'],
dtype='object')
# Boxplot 계열로 범주형 데이터를 시각화하여 분석하기
sns.boxplot(x='manufacturer', y='price', data=df.fillna('n/a'))
<Axes: xlabel='manufacturer', ylabel='price'>

범주형 데이터 클리닝하기
df.columnsIndex(['region', 'price', 'manufacturer', 'model', 'condition', 'cylinders',
'fuel', 'odometer', 'title_status', 'transmission', 'drive', 'size',
'type', 'paint_color', 'age'],
dtype='object')
# 범주형 데이터를 아래 방법 중 적절히 판단하여 처리하기
# 1. 결손 데이터가 포함된 Row를 제거
# 2. 결손 데이터를 others 범주로 변경하기
# 3. 지나치게 소수로 이루어진 범주를 others 범주로 변경하기
# (4. Classifier를 학습해서, 결손 데이터를 추정하여 채워넣기)
df['manufacturer'].fillna('others').value_counts()
ford 70985
chevrolet 55064
toyota 34202
honda 21269
nissan 19067
jeep 19014
ram 18342
others 17646
gmc 16785
bmw 14699
dodge 13707
mercedes-benz 11817
hyundai 10338
subaru 9495
volkswagen 9345
kia 8457
lexus 8200
audi 7573
cadillac 6953
chrysler 6031
acura 5978
buick 5501
mazda 5427
infiniti 4802
lincoln 4220
volvo 3374
mitsubishi 3292
mini 2376
pontiac 2288
rover 2113
jaguar 1946
porsche 1384
mercury 1184
saturn 1090
alfa-romeo 897
tesla 868
fiat 792
harley-davidson 153
ferrari 95
datsun 63
aston-martin 24
land rover 21
morgan 3
Name: manufacturer, dtype: int64
df.drop('title_status', axis=1, inplace=True)col = 'paint_color'
counts = df[col].fillna('others').value_counts()
plt.grid()
plt.plot(range(len(counts)), counts)
[<matplotlib.lines.Line2D at 0x7f0f340087f0>]
n_categorical = 7
others = counts.index[n_categorical:]
df[col] = df[col].apply(lambda s: s if str(s) not in others else 'others')
df[col].value_counts()white 79285
black 62861
silver 42970
blue 31223
red 30473
others 25449
grey 24416
Name: paint_color, dtype: int64
df.loc[df[col] == 'other', col] = 'others'
df[col].fillna('others', inplace=True)수치형 데이터 시각화하여 분석하기
# Seaborn을 이용하여 범주형 데이터를 시각화하여 분석하기
# Hint) 값의 범위가 너무 넓을 경우 histplot() 등이 잘 동작하지 않으므로, rugplot을 활용
fig = plt.figure(figsize=(8, 2))
sns.rugplot(x='price', data=df, height=1)
<Axes: xlabel='price'>

fig = plt.figure(figsize=(8, 2))
sns.rugplot(x='odometer', data=df, height=1)
<Axes: xlabel='odometer'>

sns.histplot(x='age', data=df, bins=18, kde=True)<Axes: xlabel='age', ylabel='Count'>

수치형 데이터 클리닝하기
# quantile() 메소드를 이용하여 outlier 제거하고 시각화하여 확인하기
p1 = df['price'].quantile(0.99)
p2 = df['price'].quantile(0.1)
print(p1, p2)
66995.0 500.0
df = df[(p1 > df['price']) & (df['price'] > p2)]
o1 = df['odometer'].quantile(0.99)
o2 = df['odometer'].quantile(0.1)
print(o1, o2)
280000.0 15812.0
df = df[(o1 > df['odometer']) & (df['odometer'] > o2)]
df.describe()
df.columnsIndex(['region', 'price', 'manufacturer', 'model', 'condition', 'cylinders',
'fuel', 'odometer', 'transmission', 'drive', 'size', 'type',
'paint_color', 'age'],
dtype='object')
fig = plt.figure(figsize=(10, 5))
sns.boxplot(x='manufacturer', y='price', data=df)
<Axes: xlabel='manufacturer', ylabel='price'>

fig = plt.figure(figsize=(10, 5))
sns.boxplot(x='model', y='price', data=df)
<Axes: xlabel='model', ylabel='price'>

칼럼 간의 Correlation Heatmap으로 시각화하기
sns.heatmap(df.corr(), annot=True, cmap='YlOrRd')<Axes: >

Step 4. 모델 학습을 위한 데이터 전처리
StandardScaler를 이용해 수치형 데이터 표준화하기
from sklearn.preprocessing import StandardScaler
 StandardScaler를 이용해 수치형 데이터를 표준화하기

X_num = df[['odometer', 'age']]

scaler = StandardScaler()
scaler.fit(X_num)
X_scaled = scaler.transform(X_num)
X_scaled = pd.DataFrame(X_scaled, index=X_num.index, columns=X_num.columns)

# get_dummies를 이용해 범주형 데이터를 one-hot 벡터로 변경하기
X_cat = df.drop(['price', 'odometer', 'age'], axis=1)
X_cat = pd.get_dummies(X_cat)

# 입출력 데이터 통합하기
X = pd.concat([X_scaled, X_cat], axis=1)
y = df['price']
X.head()
X.shape(335851, 60)
X.isna().sum()odometer 0
age 603
region_columbus 0
region_eugene 0
region_fresno / madera 0
region_jacksonville 0
region_others 0
region_spokane / coeur d'alene 0
manufacturer_bmw 0
manufacturer_chevrolet 0
manufacturer_ford 0
manufacturer_gmc 0
manufacturer_honda 0
manufacturer_jeep 0
manufacturer_nissan 0
manufacturer_others 0
manufacturer_ram 0
manufacturer_toyota 0
model_1500 0
model_accord 0
model_altima 0
model_camry 0
model_civic 0
model_f-150 0
model_others 0
model_silverado 0
model_silverado 1500 0
model_wrangler 0
condition_excellent 0
condition_good 0
condition_others 0
cylinders_4 cylinders 0
cylinders_6 cylinders 0
cylinders_8 cylinders 0
cylinders_others 0
fuel_gas 0
fuel_other 0
fuel_others 0
transmission_automatic 0
transmission_manual 0
transmission_other 0
drive_4wd 0
drive_fwd 0
drive_others 0
size_full-size 0
size_others 0
type_SUV 0
type_coupe 0
type_hatchback 0
type_others 0
type_pickup 0
type_sedan 0
type_truck 0
paint_color_black 0
paint_color_blue 0
paint_color_grey 0
paint_color_others 0
paint_color_red 0
paint_color_silver 0
paint_color_white 0
dtype: int64
X['age'].mean()-6.816164267063434 e-17
X.fillna(0.0, inplace=True)학습데이터와 테스트데이터 분리하기
from sklearn.model_selection import train_test_split
# train_test_split() 함수로 학습 데이터와 테스트 데이터 분리하기
X_train, X_test, y_train, y_test = train_test_split(X, y, test_size=0.3, random_state=1)
Step 5. Regression 모델 학습하기
XGBoost Regression 모델 학습하기
from xgboost import XGBRegressor
# XGBRegressor 모델 생성/학습
model_reg = XGBRegressor()
model_reg.fit(X_train, y_train)
모델 학습 결과 평가하기
from sklearn.metrics import mean_absolute_error, mean_squared_error
from math import sqrt
# Predict를 수행하고 mean_absolute_error, rmse 결과 출력하기
pred = model_reg.predict(X_test)
print(mean_absolute_error(y_test, pred))
print(sqrt(mean_squared_error(y_test, pred)))
3751.5925428381966
5744.77830956886
Step 6. 모델 학습 결과 심화 분석하기
실제 값과 추측 값의 Scatter plot 시각화하기
# y_test vs. pred Scatter 플랏으로 시각적으로 분석하기
# Hint) Scatter로 시각적 확인이 어려울 경우, histplot 등 활용
plt.scatter(x=y_test, y=pred, alpha=0.005)
plt.plot([0, 60000], [0, 60000], 'r-')
[<matplotlib.lines.Line2D at 0x7 f0 e7 ef0 a040>]

sns.histplot(x=y_test, y=pred)
plt.plot([0, 60000], [0, 60000], 'r-')
[<matplotlib.lines.Line2D at 0x7 f0 e8 f06 afd0>]

에러 값의 히스토그램 확인하기
# err의 히스토그램으로 에러율 히스토그램 확인하기
err = (pred - y_test) / y_test * 100
sns.histplot(err)
plt.xlabel('error (%)')
plt.xlim(-100, 100)
plt.grid()
# err의 히스토그램으로 에러율 히스토그램 화인하기
err = (pred - y_test)
sns.histplot(err)
plt.xlabel('error ($)')
plt.grid()


