Step 1. 데이터셋 준비하기
!pip install geopandas
!pip install pyshp
!pip install shapely
!pip install plotly-geo

Looking in indexes: https://pypi.org/simple, https://us-python.pkg.dev/colab-wheels/public/simple/
Collecting geopandas
  Downloading geopandas-0.12.2-py3-none-any.whl (1.1 MB)
     ━━━━━━━━━━━━━━━━━━━━━━━━━━━━━━━━━━━━━━━━ 1.1/1.1 MB 13.4 MB/s eta 0:00:00
Requirement already satisfied: shapely>=1.7 in /usr/local/lib/python3.9/dist-packages (from geopandas) (2.0.1)
Collecting fiona>=1.8
  Downloading Fiona-1.9.1-cp39-cp39-manylinux_2_17_x86_64.manylinux2014_x86_64.whl (16.0 MB)
     ━━━━━━━━━━━━━━━━━━━━━━━━━━━━━━━━━━━━━━━━ 16.0/16.0 MB 35.3 MB/s eta 0:00:00
Requirement already satisfied: packaging in /usr/local/lib/python3.9/dist-packages (from geopandas) (23.0)
Requirement already satisfied: pandas>=1.0.0 in /usr/local/lib/python3.9/dist-packages (from geopandas) (1.4.4)
Collecting pyproj>=2.6.1.post1
  Downloading pyproj-3.4.1-cp39-cp39-manylinux_2_17_x86_64.manylinux2014_x86_64.whl (7.7 MB)
     ━━━━━━━━━━━━━━━━━━━━━━━━━━━━━━━━━━━━━━━━ 7.7/7.7 MB 48.9 MB/s eta 0:00:00
Collecting click-plugins>=1.0
  Downloading click_plugins-1.1.1-py2.py3-none-any.whl (7.5 kB)
Collecting cligj>=0.5
  Downloading cligj-0.7.2-py3-none-any.whl (7.1 kB)
Requirement already satisfied: setuptools in /usr/local/lib/python3.9/dist-packages (from fiona>=1.8->geopandas) (63.4.3)
Collecting munch>=2.3.2
  Downloading munch-2.5.0-py2.py3-none-any.whl (10 kB)
Requirement already satisfied: attrs>=19.2.0 in /usr/local/lib/python3.9/dist-packages (from fiona>=1.8->geopandas) (22.2.0)
Requirement already satisfied: click~=8.0 in /usr/local/lib/python3.9/dist-packages (from fiona>=1.8->geopandas) (8.1.3)
Requirement already satisfied: certifi in /usr/local/lib/python3.9/dist-packages (from fiona>=1.8->geopandas) (2022.12.7)
Requirement already satisfied: python-dateutil>=2.8.1 in /usr/local/lib/python3.9/dist-packages (from pandas>=1.0.0->geopandas) (2.8.2)
Requirement already satisfied: numpy>=1.18.5 in /usr/local/lib/python3.9/dist-packages (from pandas>=1.0.0->geopandas) (1.22.4)
Requirement already satisfied: pytz>=2020.1 in /usr/local/lib/python3.9/dist-packages (from pandas>=1.0.0->geopandas) (2022.7.1)
Requirement already satisfied: six in /usr/local/lib/python3.9/dist-packages (from munch>=2.3.2->fiona>=1.8->geopandas) (1.15.0)
Installing collected packages: pyproj, munch, cligj, click-plugins, fiona, geopandas
Successfully installed click-plugins-1.1.1 cligj-0.7.2 fiona-1.9.1 geopandas-0.12.2 munch-2.5.0 pyproj-3.4.1
Looking in indexes: https://pypi.org/simple, https://us-python.pkg.dev/colab-wheels/public/simple/
Collecting pyshp
  Downloading pyshp-2.3.1-py2.py3-none-any.whl (46 kB)
     ━━━━━━━━━━━━━━━━━━━━━━━━━━━━━━━━━━━━━━━━ 46.5/46.5 KB 1.7 MB/s eta 0:00:00
Installing collected packages: pyshp
Successfully installed pyshp-2.3.1
Looking in indexes: https://pypi.org/simple, https://us-python.pkg.dev/colab-wheels/public/simple/
Requirement already satisfied: shapely in /usr/local/lib/python3.9/dist-packages (2.0.1)
Requirement already satisfied: numpy>=1.14 in /usr/local/lib/python3.9/dist-packages (from shapely) (1.22.4)
Looking in indexes: https://pypi.org/simple, https://us-python.pkg.dev/colab-wheels/public/simple/
Collecting plotly-geo
  Downloading plotly_geo-1.0.0-py3-none-any.whl (23.7 MB)
     ━━━━━━━━━━━━━━━━━━━━━━━━━━━━━━━━━━━━━━━━ 23.7/23.7 MB 34.7 MB/s eta 0:00:00
Installing collected packages: plotly-geo
Successfully installed plotly-geo-1.0.0

import pandas as pd
import numpy as np
import matplotlib.pyplot as plt
import seaborn as sns
Colab Notebook에 Kaggle API 세팅하기
import os

# os.environ을 이용하여 Kaggle API Username, Key 세팅하기
os.environ['KAGGLE_USERNAME'] = 'jhighllight'
os.environ['KAGGLE_KEY'] = 'xxxxxxxxxxxxxxxxxxxxxxx'
데이터 다운로드 및 압축 해제하기
# Linux 명령어로 Kaggle API를 이용하여 데이터셋 다운로드하기 (!kaggle ~)
# Linux 명령어로 압축 해제하기
!kaggle datasets download -d unanimad/us-election-2020
!kaggle datasets download -d muonneutrino/us-census-demographic-data
!unzip '*.zip'

Downloading us-election-2020.zip to /content
  0% 0.00/429k [00:00<?, ?B/s]
100% 429k/429k [00:00<00:00, 99.8MB/s]
Downloading us-census-demographic-data.zip to /content
 94% 10.0M/10.6M [00:00<00:00, 49.0MB/s]
100% 10.6M/10.6M [00:00<00:00, 51.0MB/s]
Archive:  us-census-demographic-data.zip
  inflating: acs2015_census_tract_data.csv
  inflating: acs2015_county_data.csv
  inflating: acs2017_census_tract_data.csv
  inflating: acs2017_county_data.csv

Archive:  us-election-2020.zip
  inflating: governors_county.csv
  inflating: governors_county_candidate.csv
  inflating: governors_state.csv
  inflating: house_candidate.csv
  inflating: house_state.csv
  inflating: president_county.csv
  inflating: president_county_candidate.csv
  inflating: president_state.csv
  inflating: senate_county.csv
  inflating: senate_county_candidate.csv
  inflating: senate_state.csv

2 archives were successfully processed.
Pandas 라이브러리로 csv파일 읽어들이기
# from US Election 2020
df_pres = pd.read_csv('president_county_candidate.csv')
df_gov = pd.read_csv('governors_county_candidate.csv')

# from US Census 2017
df_census = pd.read_csv('acs2017_county_data.csv')

# State Code 관련 부가 자료
state_code = pd.read_html('https://www.infoplease.com/us/postal-information/state-abbreviations-and-state-postal-codes')[0]
Step 2. EDA 및 데이터 기초 통계 분석
각 데이터프레임 구조 및 기초 통계 확인하기
# DataFrame에서 제공하는 메소드를 이용하여 각 데이터프레임의 구조 분석하기 (head(), info(), describe())
df_pres.head()
df_pres['candidate'].unique()

array(['Joe Biden', 'Donald Trump', 'Jo Jorgensen', 'Howie Hawkins',
       ' Write-ins', 'Gloria La Riva', 'Brock Pierce',
       'Rocky De La Fuente', 'Don Blankenship', 'Kanye West',
       'Brian Carroll', 'Ricki Sue King', 'Jade Simmons',
       'President Boddie', 'Bill Hammons', 'Tom Hoefling',
       'Alyson Kennedy', 'Jerome Segal', 'Phil Collins',
       ' None of these candidates', 'Sheila Samm Tittle', 'Dario Hunter',
       'Joe McHugh', 'Christopher LaFontaine', 'Keith McCormic',
       'Brooke Paige', 'Gary Swing', 'Richard Duncan', 'Blake Huber',
       'Kyle Kopitke', 'Zachary Scalf', 'Jesse Ventura', 'Connie Gammon',
       'John Richard Myers', 'Mark Charles', 'Princess Jacob-Fambro',
       'Joseph Kishore', 'Jordan Scott'], dtype=object)
df_gov.head()
df_census.head()
df_census['County'].value_counts()

Washington County    30
Jefferson County     25
Franklin County      24
Jackson County       23
Lincoln County       23
                     ..
Nantucket County      1
Hampden County        1
Dukes County          1
Berkshire County      1
Yauco Municipio       1
Name: County, Length: 1955, dtype: int64
state_code.head()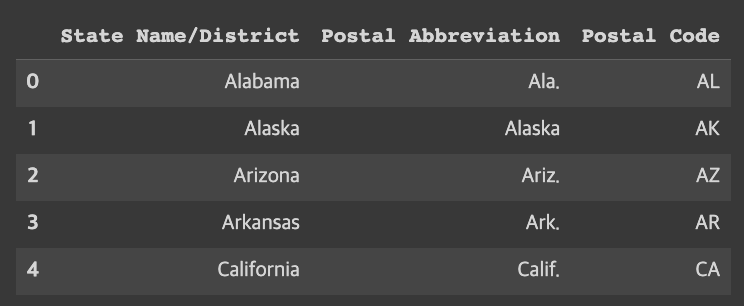
County 별 통계로 데이터프레임 구조 변경하기
# 모든 데이터프레임의 index를 County로 변경하기
data = df_pres.loc[df_pres['party'].apply(lambda s: str(s) in ['DEM', 'REP'])]
table_pres = pd.pivot_table(data=data, index=['state', 'county'], columns='party', values='total_votes')
table_pres.rename({'DEM': 'Pres_DEM', 'REP': 'Pres_REP'}, axis=1, inplace=True)
table_pres
data = df_gov.loc[df_gov['party'].apply(lambda s: str(s) in ['DEM', 'REP'])]
table_gov = pd.pivot_table(data=data, index=['state', 'county'], columns='party', values='votes')
table_gov.rename({'DEM': 'Gov_DEM', 'REP': 'Gov_REP'}, axis=1, inplace=True)
table_gov
data = df_gov.loc[df_gov['party'].apply(lambda s: str(s) in ['DEM', 'REP'])]
table_gov = pd.pivot_table(data=data, index=['state', 'county'], columns='party', values='votes')
table_gov.rename({'DEM': 'Gov_DEM', 'REP': 'Gov_REP'}, axis=1, inplace=True)
table_gov
df_census.rename({'State': 'state', 'County': 'county'}, axis=1, inplace=True)
df_census.drop('CountyId', axis=1, inplace=True)
df_census.set_index(['state', 'county'], inplace=True)
df_census
df_census.columns

Index(['TotalPop', 'Men', 'Women', 'Hispanic', 'White', 'Black', 'Native',
       'Asian', 'Pacific', 'VotingAgeCitizen', 'Income', 'IncomeErr',
       'IncomePerCap', 'IncomePerCapErr', 'Poverty', 'ChildPoverty',
       'Professional', 'Service', 'Office', 'Construction', 'Production',
       'Drive', 'Carpool', 'Transit', 'Walk', 'OtherTransp', 'WorkAtHome',
       'MeanCommute', 'Employed', 'PrivateWork', 'PublicWork', 'SelfEmployed',
       'FamilyWork', 'Unemployment'],
      dtype='object')
df_census.drop(['Income', 'IncomeErr', 'IncomePerCapErr'], axis=1, inplace=True)
df_census.drop('Women', axis=1, inplace=True)
df_census['Men'] /= df_census['TotalPop']
df_census['VotingAgeCitizen'] /= df_census['TotalPop']
df_census['Employed'] /= df_census['TotalPop']df_census.head()
여러 데이터프레임을 하나의 데이터프레임으로 결합하기
# df_pres, df_gov, df_census 데이터프레임을 하나로 결합하기
df = pd.concat([table_pres, table_gov, df_census], axis=1)
df
컬럼간의 Correlation을 Heatmap으로 표현하기
# DataFrame의 corr() 메소드와 Seaborn의 heatmap() 메소드를 이용하여 Pearson's correlation 시각화하기
plt.figure(figsize=(12, 12))
sns.heatmap(df.corr())
<AxesSubplot:>

plt.figure(figsize=(5, 12))
sns.heatmap(df.corr()[['Pres_DEM', 'Pres_REP']], annot=True)
<AxesSubplot:>

df_norm = df.copy()

df_norm['Pres_DEM'] /= df['Pres_DEM'] + df['Pres_DEM']
df_norm['Pres_REP'] /= df['Pres_DEM'] + df['Pres_DEM']
df_norm['Gov_DEM'] /= df['Gov_DEM'] + df['Gov_REP']
df_norm['Gov_REP'] /= df['Gov_DEM'] + df['Gov_REP']

# normalize된 데이터로 다시 correation 확인
plt.figure(figsize=(12, 12))
sns.heatmap(df_norm.corr())
<AxesSubplot:>
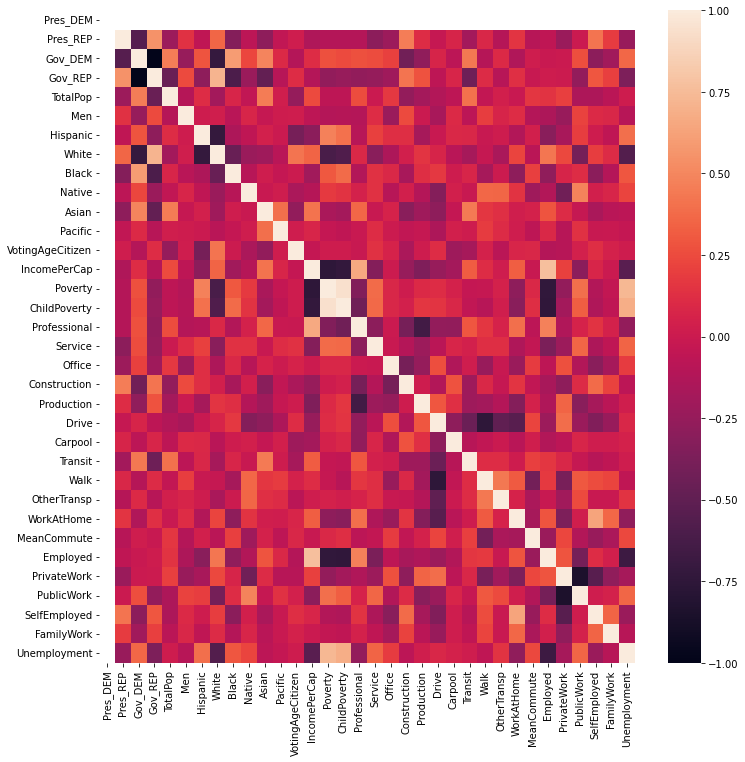
plt.figure(figsize=(5, 12))
sns.heatmap(df_norm.corr()[['Pres_DEM', 'Pres_REP']], annot=True)
<AxesSubplot:>

Seaborn을 이용하여 연관성 높은 데이터의 Jointplot 확인
sns.jointplot(x='White', y='Pres_REP', data=df_norm, alpha=0.2)<seaborn.axisgrid.JointGrid at 0x7f9f08e449d0>
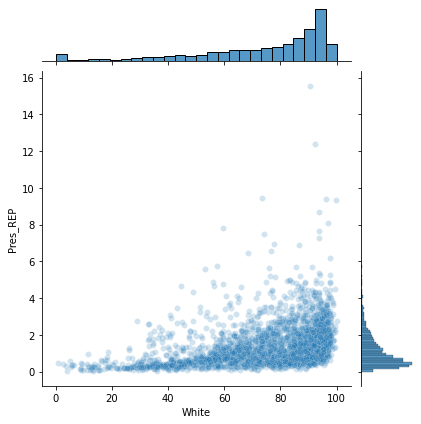
sns.jointplot(x='White', y='Pres_REP', hue='Professional', data=df_norm, alpha=0.2)
plt.show()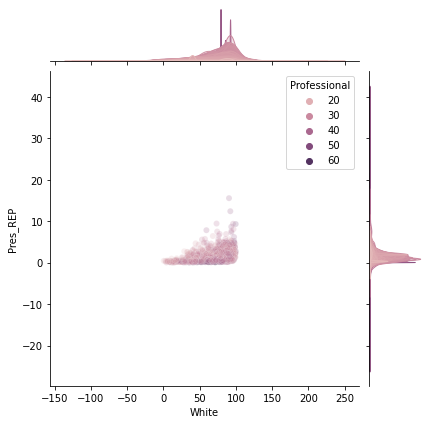
sns.jointplot(x='Black', y='Pres_DEM', data=df_norm, alpha=0.2)<seaborn.axisgrid.JointGrid at 0x7f9f06bdc760>

Step 3. Plotly를 이용하여 데이터 시각화하기
Plotly의 Choropleth 데이터 포맷으로 맞추기
import plotly.figure_factory as ff

# FIPS 코드 불러오기
df_sample = pd.read_csv('https://raw.githubusercontent.com/plotly/datasets/master/laucnty16.csv')
df_sample['State FIPS Code'] = df_sample['State FIPS Code'].apply(lambda x: str(x).zfill(2))
df_sample['County FIPS Code'] = df_sample['County FIPS Code'].apply(lambda x: str(x).zfill(3))
df_sample['FIPS'] = df_sample['State FIPS Code'] + df_sample['County FIPS Code']

# Color Scale 세팅
colorscale = ["#f7fbff","#ebf3fb","#deebf7","#d2e3f3","#c6dbef","#b3d2e9","#9ecae1",
              "#85bcdb","#6baed6","#57a0ce","#4292c6","#3082be","#2171b5","#1361a9",
              "#08519c","#0b4083","#08306b"]
df_sample.head()
state_code.head()
state_map = state_code.set_index('State Name/District')['Postal Code']
counties = df_norm.reset_index()['county'] + ', ' + df_norm.reset_index()['state'].map(state_map)
counties_to_fips = df_sample.set_index('County Name/State Abbreviation')['FIPS']
fips = counties.map(counties_to_fips)
fips

0       01001
1       01003
2       01005
3       01007
4       01009
        ...
4804      NaN
4805      NaN
4806      NaN
4807      NaN
4808      NaN
Length: 4809, dtype: object

# ff.create_choropleth()에서 사용할 수 있도록 데이터프레임 정리하기
# Hint) 공식 레퍼런스 참조: https://plotly.com/python/county-choropleth/#the-entire-usa
data = df_norm.reset_index()['Pres_DEM'][fips.notna()]
fips = fips[fips.notna()]
Step 4. 모델 학습을 위한 데이터 전처리
학습을 위한 데이터프레임 구성하기
df_norm.columns

Index(['Pres_DEM', 'Pres_REP', 'Gov_DEM', 'Gov_REP', 'TotalPop', 'Men',
       'Hispanic', 'White', 'Black', 'Native', 'Asian', 'Pacific',
       'VotingAgeCitizen', 'IncomePerCap', 'Poverty', 'ChildPoverty',
       'Professional', 'Service', 'Office', 'Construction', 'Production',
       'Drive', 'Carpool', 'Transit', 'Walk', 'OtherTransp', 'WorkAtHome',
       'MeanCommute', 'Employed', 'PrivateWork', 'PublicWork', 'SelfEmployed',
       'FamilyWork', 'Unemployment'],
      dtype='object')

# 투표 결과에 해당하는 데이터는 입력 데이터에서 제거한다.
# 예측 타겟은 DEM vs. REP 투표 비율로 한다.
df_norm.dropna(inplace=True)
X = df_norm.drop(['Pres_DEM', 'Pres_REP', 'Gov_DEM', 'Gov_REP'], axis=1)
y = df_norm['Pres_DEM']
StandardScaler를 이용해 수치형 데이터 표준화하기
from sklearn.preprocessing import StandardScaler

# StandardScaler를 이용해 수치형 데이터를 표준화하기
scaler = StandardScaler()
scaler.fit(X)
X_scaled = scaler.transform(X)
X = pd.DataFrame(data=X_scaled, index=X.index, columns=X.columns)

X.head()
학습데이터와 테스트데이터 분리하기
from sklearn.model_selection import train_test_split

# train_test_split() 함수로 학습 데이터와 테스트 데이터 분리하기
X_train, X_test, y_train, y_test = train_test_split(X, y, test_size=0.3, random_state=1)
PCA를 이용해 데이터 전처리 수행하기
from sklearn.decomposition import PCA

# PCA를 이용해 Dimensionality Reduction 수행하기
pca = PCA()
pca.fit(X_train)
plt.plot(range(1, len(pca.explained_variance_) + 1), pca.explained_variance_)
plt.grid()
Step 5. Regression 모델 학습하기
LightGBM Regression 모델 학습하기
from lightgbm import LGBMRegressor

# LGBMRegressor 모델 생성/학습. Feature에 PCA 적용하기
model_reg = LGBMRegressor()
# model_reg.fit(pca.transform(X_train), y_train)
model_reg.fit(X_train, y_train)
Regression 모델 정확도 출력하기
from sklearn.metrics import mean_absolute_error, mean_squared_error
from sklearn.metrics import classification_report
from math import sqrt

# Predict를 수행하고 mean_absolute_error, mean_squared_error, classification_report 결과 출력하기
pred = model_reg.predict(X_test)
print(mean_absolute_error(y_test, pred))
print(sqrt(mean_squared_error(y_test, pred)))
print(classification_report(y_test > 0.5, pred > 0.5))

0.0
0.0
              precision    recall  f1-score   support

       False       1.00      1.00      1.00       163

    accuracy                           1.00       163
   macro avg       1.00      1.00      1.00       163
weighted avg       1.00      1.00      1.00       163
Step 6. Classification 모델 학습하기
XGBoost 모델 생성/학습하기
from xgboost import XGBClassifier

# XGBClassifier 모델 생성/학습
model_cls = XGBClassifier()
model_cls.fit(X_train, y_train > 0.5)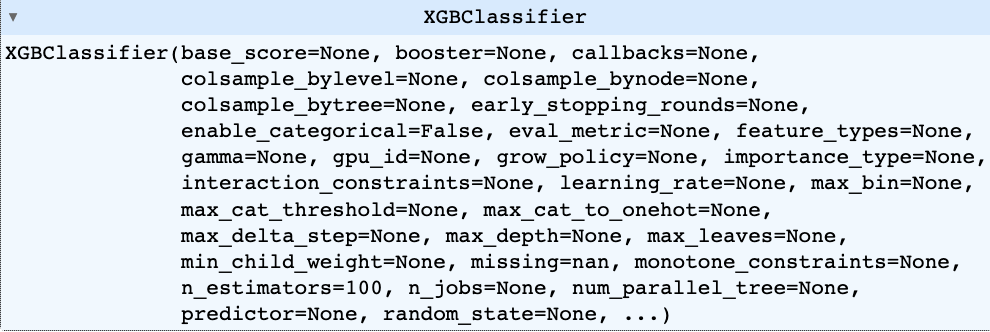
Classifier 모델 정확도 출력하기
# Predict를 수행하고 classification_report() 결과 출력하기
pred = model_cls.predict(X_test)
print(classification_report(y_test > 0.5, pred))

              precision    recall  f1-score   support

       False       1.00      1.00      1.00       163

    accuracy                           1.00       163
   macro avg       1.00      1.00      1.00       163
weighted avg       1.00      1.00      1.00       163


