데이터 다운로드
# 데이터 다운로드 링크로 데이터를 코랩에 불러옵니다.

!wget 'https://bit.ly/3gLj0Q6'

import zipfile
with zipfile.ZipFile('3gLj0Q6', 'r') as existing_zip:
    existing_zip.extractall('data')
--2023-01-12 03:54:03--  https://bit.ly/3gLj0Q6
Resolving bit.ly (bit.ly)... 67.199.248.10, 67.199.248.11
Connecting to bit.ly (bit.ly)|67.199.248.10|:443... connected.
HTTP request sent, awaiting response... 301 Moved Permanently
Location: https://drive.google.com/uc?export=download&id=1or_QN1ksv81DNog6Tu_kWcZ5jJWf5W9E [following]
--2023-01-12 03:54:03--  https://drive.google.com/uc?export=download&id=1or_QN1ksv81DNog6Tu_kWcZ5jJWf5W9E
Resolving drive.google.com (drive.google.com)... 74.125.137.139, 74.125.137.102, 74.125.137.113, ...
Connecting to drive.google.com (drive.google.com)|74.125.137.139|:443... connected.
HTTP request sent, awaiting response... 303 See Other
Location: https://doc-0c-10-docs.googleusercontent.com/docs/securesc/ha0ro937gcuc7l7deffksulhg5h7mbp1/rlk45kq515j20ijgfvle2nthraplnf9i/1673495625000/17946651057176172524/*/1or_QN1ksv81DNog6Tu_kWcZ5jJWf5W9E?e=download&uuid=9a4f75e7-5635-4148-88d1-6611b432bb04 [following]
Warning: wildcards not supported in HTTP.
--2023-01-12 03:54:03--  https://doc-0c-10-docs.googleusercontent.com/docs/securesc/ha0ro937gcuc7l7deffksulhg5h7mbp1/rlk45kq515j20ijgfvle2nthraplnf9i/1673495625000/17946651057176172524/*/1or_QN1ksv81DNog6Tu_kWcZ5jJWf5W9E?e=download&uuid=9a4f75e7-5635-4148-88d1-6611b432bb04
Resolving doc-0c-10-docs.googleusercontent.com (doc-0c-10-docs.googleusercontent.com)... 142.250.141.132, 2607:f8b0:4023:c0b::84
Connecting to doc-0c-10-docs.googleusercontent.com (doc-0c-10-docs.googleusercontent.com)|142.250.141.132|:443... connected.
HTTP request sent, awaiting response... 200 OK
Length: 39208 (38K) [application/zip]
Saving to: ‘3gLj0Q6’

3gLj0Q6             100%[===================>]  38.29K  --.-KB/s    in 0s

2023-01-12 03:54:04 (96.5 MB/s) - ‘3gLj0Q6’ saved [39208/39208]
라이브러리 불러오기
# 라이브러리 불러오기
# import [라이브러리] as [사용할 이름]
# 판다스 , 넘파이

import pandas as pd
import numpy as np
파일 불러오기
파이썬에서 데이터 파일(csv 파일)을 불러오기 위해서는 pandas 라이브러리를 이용해야 합니다.
pandas 라이브러리를 먼저 import 해주고, pandas의 read_csv 메서드를 이용해 파일을 불러올 수 있습니다.
#import pandas as pd
#data = pd.read_csv('파일경로/파일이름.csv')

train = pd.read_csv('data/train.csv')
test = pd.read_csv('data/test.csv')
EDA
# 데이터 상위 5개 행 확인하기
#train
train.head()
#test
test.head()
# 행열 갯수 관찰하기 - shape
print('train의 행열 갯수 :', train.shape)
print('test의 행열 갯수 :', test.shape)
train의 행열 갯수 : (1459, 11)
test의 행열 갯수 : (715, 10)

# 결측치 확인하기
train.isnull().sum()
id                          0
hour                        0
hour_bef_temperature        2
hour_bef_precipitation      2
hour_bef_windspeed          9
hour_bef_humidity           2
hour_bef_visibility         2
hour_bef_ozone             76
hour_bef_pm10              90
hour_bef_pm2.5            117
count                       0
dtype: int64

test.isnull().sum()
id                         0
hour                       0
hour_bef_temperature       1
hour_bef_precipitation     1
hour_bef_windspeed         1
hour_bef_humidity          1
hour_bef_visibility        1
hour_bef_ozone            35
hour_bef_pm10             37
hour_bef_pm2.5            36
dtype: int64

# 데이터 정보 확인
train.info()
<class 'pandas.core.frame.DataFrame'>
RangeIndex: 1459 entries, 0 to 1458
Data columns (total 11 columns):
 #   Column                  Non-Null Count  Dtype
---  ------                  --------------  -----
 0   id                      1459 non-null   int64
 1   hour                    1459 non-null   int64
 2   hour_bef_temperature    1457 non-null   float64
 3   hour_bef_precipitation  1457 non-null   float64
 4   hour_bef_windspeed      1450 non-null   float64
 5   hour_bef_humidity       1457 non-null   float64
 6   hour_bef_visibility     1457 non-null   float64
 7   hour_bef_ozone          1383 non-null   float64
 8   hour_bef_pm10           1369 non-null   float64
 9   hour_bef_pm2.5          1342 non-null   float64
 10  count                   1459 non-null   float64
dtypes: float64(9), int64(2)
memory usage: 125.5 KB

test.info()
<class 'pandas.core.frame.DataFrame'>
RangeIndex: 715 entries, 0 to 714
Data columns (total 10 columns):
 #   Column                  Non-Null Count  Dtype
---  ------                  --------------  -----
 0   id                      715 non-null    int64
 1   hour                    715 non-null    int64
 2   hour_bef_temperature    714 non-null    float64
 3   hour_bef_precipitation  714 non-null    float64
 4   hour_bef_windspeed      714 non-null    float64
 5   hour_bef_humidity       714 non-null    float64
 6   hour_bef_visibility     714 non-null    float64
 7   hour_bef_ozone          680 non-null    float64
 8   hour_bef_pm10           678 non-null    float64
 9   hour_bef_pm2.5          679 non-null    float64
dtypes: float64(8), int64(2)
memory usage: 56.0 KB

#수치데이터 특성 보기

train.describe()
# 시각화에 필요한 라이브러리를 import
import matplotlib
import matplotlib.pyplot as plt
import seaborn as sns

# 마이너스 기호 출력
plt.rc('axes', unicode_minus=False)

# 분석에 문제가 없는 경고 메세지는 숨긴다.
import warnings
warnings.filterwarnings('ignore')

sns.histplot(train['count'])
<matplotlib.axes._subplots.AxesSubplot at 0x7fafbe055e50>
train.corr()
import seaborn as sns
plt.figure(figsize = (12,12))
sns.heatmap(train.corr(),annot = True)
sns.barplot(x = 'hour', y = 'count', data = train)
<matplotlib.axes._subplots.AxesSubplot at 0x7fafbdef8130>
데이터 전처리
결측치 처리하기
# 결측치 데이터 제거
train.dropna(inplace = True)

# 결측치 특정 상수 값으로 대체
train.fillna(0,inplace = True)

# 결측치 해당 변수 평균 값으로 대체
train.fillna(train.mean(),inplace = True)
test.fillna(train.mean(),inplace = True)

# 결측치 보간법으로 채우기
train.interpolate(inplace=True)
연속형 변수 변환
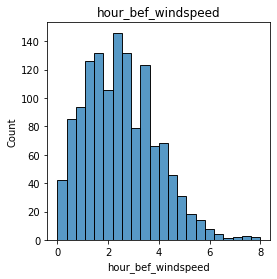
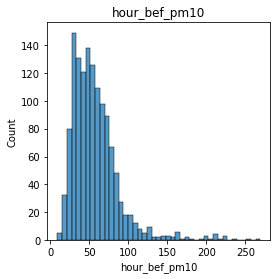
# 연속형 변수 시각화.
for col in train.columns:
  plt.figure(figsize = (4,4))
  plt.title(col)
  sns.histplot(train[col])
  plt.show()


# 데이터 분포가 불균형한 경우  Min-Max Normalization

#train['hour_bef_pm2.5'] = np.log1p(train['hour_bef_pm2.5'])
#train['hour_bef_pm10'] = np.log1p(train['hour_bef_pm10'])

test['hour_bef_pm2.5'] = np.log1p(test['hour_bef_pm2.5'])
test['hour_bef_pm10'] = np.log1p(test['hour_bef_pm10'])

sns.histplot(train['hour_bef_pm2.5'])
<matplotlib.axes._subplots.AxesSubplot at 0x7fafcdbf9b80>
모델링
from sklearn.ensemble import RandomForestRegressor
model = RandomForestRegressor()

X_train = train.drop(['id', 'count'], axis = 1)
y_train = train['count']
X_test = test.drop('id', axis = 1)

from sklearn.model_selection import GridSearchCV

RandomForestRegressor()

param = {'min_samples_split': [30, 50, 70],
        'max_depth': [5, 6, 7],
        'n_estimators': [50, 150, 250]}

gs = GridSearchCV(estimator=model, param_grid=param, scoring = 'neg_mean_squared_error', cv = 3)

gs.fit(X_train, y_train)
GridSearchCV(cv=3, estimator=RandomForestRegressor(),
             param_grid={'max_depth': [5, 6, 7],
                         'min_samples_split': [30, 50, 70],
                         'n_estimators': [50, 150, 250]},
             scoring='neg_mean_squared_error')
제출 파일 생성
submission = pd.read_csv('data/submission.csv')

pred = gs.predict(X_test)

submission['count']  = pred

submission.to_csv('gridsearch.csv', index = False)'Python > DACON' 카테고리의 다른 글
| DACON Python 튜토리얼 Lv4. 교차검증과 모델 앙상블을 활용한 와인 품질 분류하기 (2) | 2023.01.19 |
|---|---|
| DACON Python 튜토리얼 Lv3. 교차검증과 LGBM 모델을 활용한 와인 품질 분류하기 (0) | 2023.01.16 |
| DACON Python 튜토리얼 Lv1. 의사결정회귀나무로 따릉이 데이터 예측하기 (0) | 2023.01.11 |


