데이터 소개
- 총 10개의 파일 중 2개의 Raw 데이터를 사용합니다.
RAW_global_confirmed_cases.csv
RAW_global_global_deaths.csv
- 각 파일의 칼럼은 아래와 같습니다.
Country/Region: 국가
Province/State: 지방/주
Lat: 지역의 위도
Long: 지역의 경도
날짜: 각 날짜의 확진자/사망자 수
- 데이터 출처: https://www.kaggle.com/antgoldbloom/covid19-data-from-john-hopkins-university
import pandas as pd
import numpy as np
import matplotlib.pyplot as plt
import seaborn as sns
import osos.environ['KAGGLE_USERNAME'] = 'jhighllight'
os.environ['KAGGLE_KEY'] = 'xxxxxxxxxxxxxxxxxxxx'!rm *.*
!kaggle datasets download -d antgoldbloom/covid19-data-from-john-hopkins-university
!unzip '*.zip'df_case = pd.read_csv('RAW_global_confirmed_cases.csv')
df_death = pd.read_csv('RAW_global_deaths.csv')df_case.head()
df_death.head()
def fix_dataframe(df):
  df = df.drop(['Lat', 'Long'], axis=1).groupby('Country/Region').sum()
  df = df.transpose()
  df.index.name = 'Date'
  df.reset_index(inplace=True)
  df['Date'] = df['Date'].apply(lambda s: pd.to_datetime(str(s)))
  df.set_index('Date', inplace=True)
  return df
df_case = fix_dataframe(df_case)
df_death = fix_dataframe(df_death)
<ipython-input-13-8370bf488dd3>:3: FutureWarning: The default value of numeric_only in DataFrameGroupBy.sum is deprecated. In a future version, numeric_only will default to False. Either specify numeric_only or select only columns which should be valid for the function.
df = df.drop(['Lat', 'Long'], axis=1).groupby('Country/Region').sum()
df_case
df_death
top_ten_cases = df_case.loc[df_case.index[-1]].sort_values(ascending=False)[:10]
sns.barplot(x=top_ten_cases.index, y=top_ten_cases, color='black')
plt.xticks(rotation=90, size=15)
plt.ylabel('Total Confirmed Cases', size=15)
plt.xlabel('')
plt.title('Total Confirmed Cases (%s)' % top_ten_cases.name.strftime('%Y-%m-%d'), size=15)

ax = plt.gca()
ax2 = ax.twinx()
top_ten_deaths = df_death.loc[df_death.index[-1]][top_ten_cases.index]
ax2.plot(top_ten_deaths.index, top_ten_deaths, 'r--')
ax2.set_ylabel('Total Deaths', color='red', size=15)
plt.show()
def plot_case_with_death(country):
    plt.plot(df_case.index, df_case[country], 'b-')
    plt.ylabel('Confirmed Cases', color='blue')
    plt.title(country + 'Cases & Deaths')
    plt.xlabel('Date')
    plt.xlim(right=df_case.index[-1])
    plt.ylim(0, df_case[country].max()*1.1)

    ax = plt.gca()
    ax2 = ax.twinx()
    ax2.plot(df_death.index, df_death[country], 'r--')
    ax2.set_ylabel('Deaths', color='red')
    ax2.set_ylim(0, df_death[country].max()*1.3)
    plt.show()
plot_case_with_death('US')
for c in df_case.columns:
    print(c)
Afghanistan
Albania
Algeria
Andorra
Angola
Antarctica
Antigua and Barbuda
Argentina
Armenia
Australia
Austria
Azerbaijan
Bahamas
Bahrain
:
:
US
Uganda
Ukraine
United Arab Emirates
United Kingdom
Uruguay
Uzbekistan
Vanuatu
Venezuela
Vietnam
West Bank and Gaza
Winter Olympics 2022
Yemen
Zambia
Zimbabwe
plot_case_with_death('Germany')
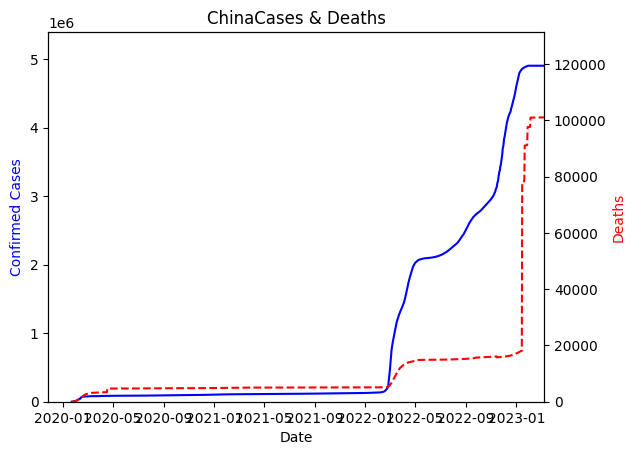
plot_case_with_death('China')
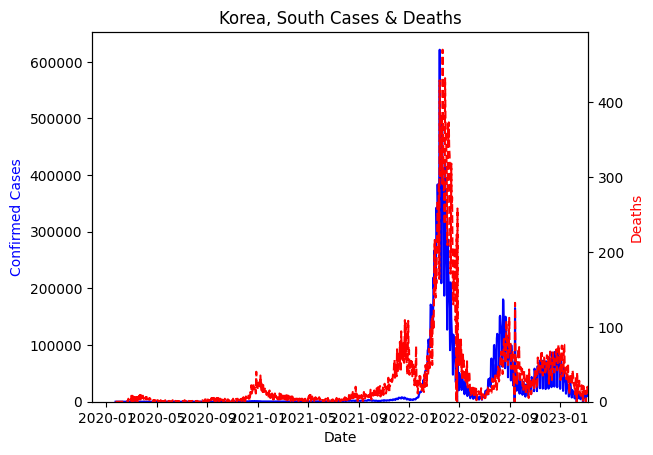
plot_case_with_death('Korea, South')
country = 'Korea, South'
plt.plot(df_case.index, df_case[country].diff(), 'b-')
plt.ylabel('Confirmed Cases', color='blue')
plt.title(country + ' Cases & Deaths')
plt.xlabel('Date')
plt.xlim(right=df_case.index[-1])
plt.ylim(bottom=0)

ax = plt.gca()
ax2 = ax.twinx()
ax2.plot(df_death.index, df_death[country].diff(), 'r--')
ax2.set_ylabel('Deaths', color='red')
ax2.set_ylim(bottom=0)
plt.show()
import plotly.graph_objects as go# 아래 데이터프레임를 이용하여 국가명을 국가코드로 변경
df_code = pd.read_csv('https://raw.githubusercontent.com/plotly/datasets/master/2014_world_gdp_with_codes.csv')
# 이름이 다르게 쓰인 국가의 이름을 먼저 변경한 후에 코드로 변경
country_renamer = {
'Bahamas':'Bahamas, The',
'Congo (Brazzaville)':'Congo, Republic of the',
'Congo (Kinshasa)':'Congo, Democratic Republic of the',
'Czechia':'Czech Republic',
'Eswatini':'Swaziland',
'Gambia':'Gambia, The',
'North Macedonia':'Macedonia',
'Taiwan*':'Taiwan',
'US':'United States',
'West Bank and Gaza':'West Bank'
}df_case.head()
country_to_code = df_code.set_index('COUNTRY')['CODE']df_c = df_case.rename(country_renamer, axis=1).copy()
for col in df_c.columns:
if col not in country_to_code.index:
df_c.drop(col, axis=1, inplace=True)
df_code = df_c.rename(country_to_code, axis=1)
df_code
# 공식 레퍼런스 참조: https://plotly.com/python/choropleth-maps/#world-choropleth-map
def get_choropleth_data(date):
  # TODO: date에 해당하는 날짜로 데이터 생성
  data = go.Choropleth(
    locations = df_code.columns,
    z = df_code.loc[date],
    text = df_c.columns,
    colorscale = 'Blues',
    autocolorscale=False,
    reversescale=True,
    marker_line_color='darkgray',
    marker_line_width=0.5,
    colorbar_tickprefix = '$',
    colorbar_title = 'Confirmed Cases',
  )
  return data
# 공식 레퍼런스 참조: https://plotly.com/python/choropleth-maps/#world-choropleth-map
def get_choropleth_data(date):
# TODO: date에 해당하는 날짜로 데이터 생성
data = go.Choropleth(
locations = df_code.columns,
z = df_code.loc[date],
text = df_c.columns,
colorscale = 'Blues',
autocolorscale=False,
reversescale=True,
marker_line_color='darkgray',
marker_line_width=0.5,
colorbar_tickprefix = '$',
colorbar_title = 'Confirmed Cases',
)
return data# 공식 레퍼런스 참조: https://facebook.github.io/prophet/docs/quick_start.html#python-api
# 한국의 확진자 수 데이터를 FBProphet에 학습하기 위한 데이터프레임으로 재구성하시오.
df = pd.DataFrame(df_case.reset_index()[['Date', 'Korea, South']].to_numpy(), columns=['ds', 'y'])
df
from math import floordef train_test_split_df(df, test_size):
# TODO: test_size(0 < test_size < 1) 비율에 따라 테스트/학습 데이터프레임으로 나누어 반환
div = floor(df.shape[0] * (1 - test_size))
return df.loc[:div], df.loc[div + 1:]train_df, test_df = train_test_split_df(df, 0.1)train_df.tail()
test_df.head()


